D-Lib Magazine
September/October 2016
Volume 22, Number 9/10
Table of Contents
An Analysis of the Microsoft Academic Graph
Drahomira Herrmannova and Petr Knoth
Knowledge Media Institute, The Open University, Milton Keynes, UK
{drahomira.herrmannova, petr.knoth}@open.ac.uk
DOI: 10.1045/september2016-herrmannova
Printer-friendly Version
Abstract
In this paper we analyse a new dataset of scholarly publications, the Microsoft Academic Graph (MAG). The MAG is a heterogeneous graph comprised of over 120 million publication entities and related authors, institutions, venues and fields of study. It is also the largest publicly available dataset of citation data. As such, it is an important resource for scholarly communications research. As the dataset is assembled using automatic methods, it is important to understand its strengths and limitations, especially whether there is any noise or bias in the data, before applying it to a particular task. This article studies the characteristics of the dataset and provides a correlation analysis with other publicly available research publication datasets to answer these questions. Our results show that the citation data and publication metadata correlate well with external datasets. The MAG also has very good coverage across different domains with a slight bias towards technical disciplines. On the other hand, there are certain limitations to completeness. Only 30 million papers out of 127 million have some citation data. While these papers have a good mean total citation count that is consistent with expectations, there is some level of noise when extreme values are considered. Other current limitations of MAG are the availability of affiliation information, as only 22 million papers have these data, and the normalisation of institution names.
Keywords: Scholarly Communication; Publication Datasets; Open Citation Data; Data Mining; Research Evaluation
1 Introduction
There is an ever growing interest in datasets of scholarly publications. Research evaluation and analysis, recommender systems, search relevance ranking and literature based discovery are only some of the research areas which make use of this data. However, one of the biggest obstacles in this area is the difficulty in accessing the publications, which is caused by many factors, from the sheer number of articles being published every day and the number of publishing venues, to the copyright restrictions put in place by the publishers. Several research publication datasets which are free to use exist, however, these are often incomplete (for example, restricted to only one or a few publishers, research areas, publication years, etc., or are missing some type of data, for example citations, abstracts or full-texts).
This situation improved recently when Microsoft published its Microsoft Academic Graph (MAG) [16], a large heterogeneous graph comprised of more than 120 million publications and the related authors, venues, organizations, and fields of study. As of today, the MAG is the largest publicly available dataset of scholarly publications and the largest dataset of open citation data. However, as the dataset is assembled using automatic methods [16], before a decision can be made on whether to use it, for what purposes and with what limitations, it is important to understand how accurate it is and whether there is any noise or bias in the data. This article aims to answer this question. What interests us is the level of reliability of the data. The characteristics of the dataset are studied here by comparing the data with other publicly available research publication datasets. Among other things we are interested in topical and temporal coverage and in the properties of the citation network.
This paper is organised as follows. In Section 2, we describe the MAG dataset and present our approach to its analysis. Section 3 presents the results of the analysis. We summarise our findings in Section 4.
2 Dataset and Method
The Microsoft Academic Graph is a large heterogeneous graph which models scholarly communication activities and which consists of six types of entities — publications, authors, institutions (affiliations), venues (journals and conferences), fields of study and events (specific conference instances); and the relations between these entities — citations, authorship, etc. The relations between the entities are described in more detail in [16]. The dataset contains publication metadata, such as year of publication, title and DOI. It doesn't contain the publication fulltexts or abstracts. For our study we used the latest available version of MAG (5 February 2016). Table 1 shows the size of the dataset.
| Papers |
126,909,021 |
| Authors |
114,698,044 |
| Institutions |
19,843 |
| Journals |
23,404 |
| Conferences |
1,283 |
| Conference instances |
50,202 |
| Fields of study |
50,266 |
Table 1: Dataset size
We are interested in analysing the dataset to understand its properties. Specifically, we are interested in answering the following questions:
- How sparse are the data (in terms of temporal properties, discipline coverage, institution/country representation, etc.)?
- How many of the entities have all associated metadata fields populated and how reliable are these data (for example publication years and fields of study)?
- How well are the data conflated/disambiguated (for example the author entities)?
Some of these questions can be answered by analysing the dataset directly. However, a manual evaluation or a comparison with another overlapping dataset could provide additional insights. As other publicly available sources of data are available, we have used these sources to study the accuracy and reliability of the dataset.
Specifically, we used the CORE [12], Mendeley
[10], the Webometrics Ranking of World Universities [5] and the Scimago Journal & Country Rank [4]. CORE is an aggregator of content stored in Open Access repositories and journals; its data include publication full-texts (where available) in both PDF and text formats, as well as automatically extracted citations. At present CORE contains over
25 million publication records. Mendeley is a crowdsourced collection of millions of research publications, offering metadata including abstracts, venue information, etc., however not citations and full-texts. As of writing this article the collection contains more than 100 million publications. The Webometrics Ranking of World Universities is an initiative publishing webometric rankings of universities, but also a list of top universities from around the world based on citation data assembled from Google Scholar. Finally, the Scimago Journal & Country Rank website publishes journal and country rankings which are prepared using data from Elsevier Scopus. We use the first two datasets to study how reliable the metadata in the MAG are, while the other two datasets are used to study the citation network.
All but the last of these datasets are, similar to the MAG, assembled largely using automatic methods (crawling, harvesting, etc.), which means these datasets could also suffer from bias or noise. For this reason, we did not aim to find whether one of the datasets is better than the others, but rather to see whether there are similarities
and the datasets are comparable. We believe that if we find a correlation and significant similarities between all of the datasets, it will show a certain level of accuracy and reliability.
3 Results
3.1 Publication age
The year of publication is one of the most important pieces of information about a publication for bibliometrics research. Consequently, it is critical that the data are reliable and consistent. For this reason our first task was to investigate the years of publication provided in the MAG.
The publication metadata contain titles, publication dates, DOIs and venue names (which are linked to venue entities). Impressively, the year of publication is populated for all papers in the dataset. Figure 1 shows a histogram of the publication years.
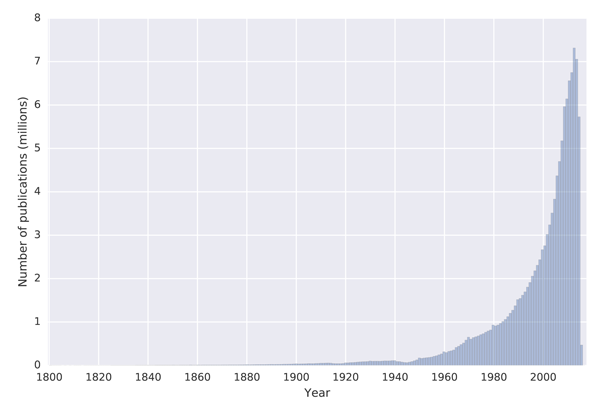
Figure 1: Histogram of years of publication provided in the MAG
To asses how reliable the publication dates in the MAG are, we have compared this data with dates obtained from CORE and Mendeley. To identify common publications between the three datasets, we used the Digital Object Identifier (DOI). Table 2 lists the number of common documents we were able to identify. The last row in the table represents the number of documents after removing documents with any missing data, that is publications for which we were not able to obtain the publication date from one or more of the datasets.
| Unique DOIs in the MAG |
35,569,305 |
| Unique DOIs in CORE |
2,673,592 |
| Intersection MAG/CORE |
1,690,668 |
| Intersection MAG/CORE/Mendeley |
1,314,854 |
| Intersection Without Missing Data |
1,258,611 |
Table 2: Number of documents used for comparing publication dates in the MAG, CORE and Mendeley
We have compared the datasets using two methods — the Spearman's rho correlation coefficients and the cumulative distribution function of the difference between the publication years in the different datasets. Table 3 shows the Spearman's rho correlation coefficients. The Spearman's rho correlations are all very strong (close to 1.0), the strongest correlation is between Mendeley and CORE (rho = 0.9743), the weakest is between the MAG and CORE (rho = 0.9555). To assess how big are the differences between the datasets we have calculated the cumulative distribution function of
the differences between the three datasets.
| Spearman's rho |
MAG |
CORE |
Mendeley |
| MAG |
— |
0.9555 |
0.9656 |
| CORE |
0.9555 |
— |
0.9743 |
| Mendeley |
0.9656 |
0.9743 |
— |
Table 3: Correlations between publication years found in the MAG, CORE and Mendeley. The p-value < 0:01 in all cases.
To see in how many cases do the datasets agree, we have calculated the cumulative distribution function of the difference between the data (Figure 2). To plot this function we use the absolute difference between the year of publication found in two datasets. Each point in the figure represents the proportion of publications for which the difference equals or is less than the value on the x-axis. The faster the line in the figure grows the more publications have the same or similar year of publication in the two datasets.
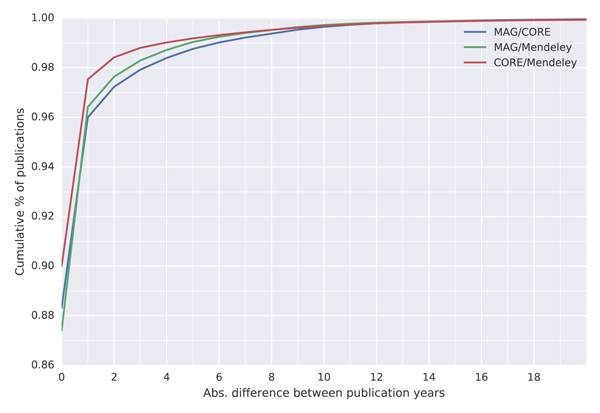
Figure 2: Cumulative distribution function of absolute difference between publication years found in the three datasets
For all three comparisons the year of publication is the same in more than 87% of cases, which represents more than 1 million publications. The most similarities are found between CORE and Mendeley, where the year of publication differs by zero years in ~ 90% of cases. A potential explanation for a difference of up to one year could be that one dataset contains the postprint version while the other a preprint, which was deposited online before the postprint version was published. MAG compares to the two other datasets very similarly, with ~ 88% of papers having a difference of zero years and more than 96% of paper differing by zero or one year in both cases. That is, out of the 1.2 million publications less than 40 thousand have a difference of more than two years.
3.2 Authors and affiliations
The publications in the graph are linked to author and institution entities, which are both (to a certain level) disambiguated. Table 4 presents summary statistics of the two networks. It is interesting to notice all publications in the graph are linked to one or more author entities, however 105,980,107 publications are not affiliated with any institution. Furthermore, while the mean values presented in Table 4 are similar to numbers reported for other datasets [11, 14], the maximum values point to some discrepancies in the data. For example, the highest number of authors on a publication was reported to be 5,154 [8]. In MAG this article comes fourth in terms of number of authors after papers titled "Sunday, 26 August 2012", "Monday, 27 August 2012" and "Tuesday, 28 August 2012". Furthermore, the
most prolific author is "united vertical media gmbh". However, because the graph is built using automatic methods, such errors are expected. In order to understand how reliable the data in MAG are, we have compared the most cited institutions in MAG to the most cited institutions according to the Ranking Web of Universities website [5], which uses data from Google Scholar. The results of this comparison are presented in Section 3.5. We haven't done the same comparison for the author entities due to potential disambiguation issues.
| Mean number of authors per paper |
2.66 |
| Max authors per paper |
6,530 |
| Mean number of papers per author |
2.94 |
| Max number of papers per author |
153,915 |
| Mean number of collaborators |
116.93 |
| Max number of collaborators |
3,661,912 |
|
| Number of papers with affiliation |
20,928,914 |
| Mean number of affiliations per paper |
0.23 |
| Max number of affiliations per paper |
181 |
Table 4: Summary statistics for the authorship and affiliation networks
3.3 Journals and conferences
Similarly as with the author and affiliation entities, the papers in MAG are linked to publication venues — journals and conferences. Aside from a list of conferences consisting of a name and abbreviation (e.g. "JCDL — ACM/IEEE Joint Conference on Digital Libraries") the MAG also contains a list of conference instances containing information on when and where the conference took place. There are 51,900,106 publications in MAG which are linked to a journal entity and 1,716,211 publications linked to a conference. Interestingly, 103,131 publications are linked to both a journal and a conference. We have manually investigated several of these publications and found that in cases this was due to a paper being presented at a conference and later in proceedings published as a journal. Similarly as with affiliations, we have compared journal citation data from MAG with citation data obtained from the Scimago Journal & Country Rank website [4], which uses Elsevier Scopus data. The results of this comparison are presented in Section 3.5.
3.4 Fields of study
Information about which field or fields of study does a publication belong to is very valuable for many tasks. At the same time this information is often complicated to get, as it is dependent on either having access to the text of the publication or access to manually created metadata. We investigate the fields of study provided by MAG for papers
in the graph in order to understand what the coverage of the dataset is.
The fields of study found in MAG are organised hierarchically into four levels (level 0 to level 3, where level 3 has the highest granularity). There are 47,989 fields of study at level 3 (e.g. "concerted evolution"), 1,966 at level 2 (e.g. "evolutionary developmental biology"), 293 at level 1 (e.g. "genetics") and 18 at level 0 (e.g. "biology"). Out of the 126,909,021 total papers, 41,739,531 (about ~ 33%) are linked to one or more field of study entities. Figure 3 shows the distribution of papers over the 18 level 0 fields of study. In cases where the publication was linked to more than one level 0 field of study, we have counted it towards each linked field of study.
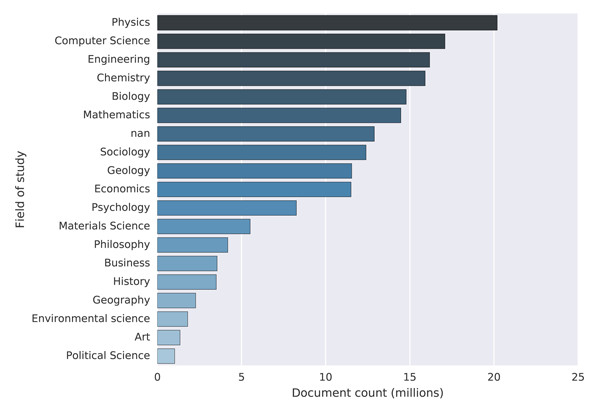
Figure 3: Distribution of papers into fields of study in MAG
It can be seen that the three largest fields of study in MAG are Physics, Computer Science and Engineering, followed by Chemistry and Biology. This is to a certain degree consistent with other studies, which have reported Physics and Engineering to be among the largest disciplines in terms of number of publications, however Medicine and Biology are typically reported to be the most productive [6, 9]. One possible explanation for this bias towards the three technical fields could be due how the data is being collected. According to [16] this is done, aside from using publisher feeds, by crawling the web. This could create bias towards scientific disciplines which tend to publish and deposit their publications online more frequently and therefore make their publications more easily discoverable.
For comparison we obtained information about readers from Mendeley for the 1,258,611 publications used in comparing the publication years in MAG, CORE and Mendeley (Section 3.1). Our assumption is that the readers will bookmark publications related to their research area, and based on this assumption, we use the readers' research area to assign the papers to scientific disciplines. We use the proportion of readers in a given area to assign the publication to the area, for example if a publication has 15 readers in Biology and 5 readers in Chemistry, we would add 0.75 to the first area and 0.25 to the second. At the lowest level of granularity Mendeley classifies publications into 22 disciplines. The distribution of the 1,258,611 papers into the 22 disciplines can be seen in Figure 4.
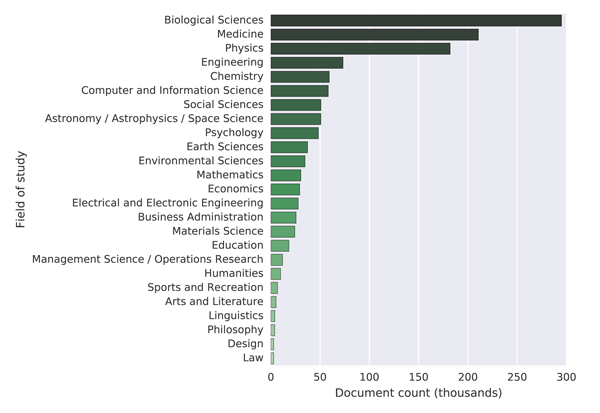
Figure 4: Distribution of papers into fields of study in Mendeley
3.5 Citation network
One part of the dataset which is very interesting to us is the citation network. In order to understand how reliable the citation data in the MAG are, we study the citation network from several perspectives. First, we study the network by itself by looking at the citation distribution, to see whether it is consistent with previous studies. We then compare the citations received by two types of entities (institutions and journals) in the graph with citations from external datasets.
The MAG contains 528,682,289 internal citations (citations between the papers in the graph). This means each paper in the graph is cited on average 4.17 times. However, a significant portion of the papers are disconnected from the network (neither cite nor are cited by any other papers). Table 5 shows the number of disconnected nodes. There are over 80 million such nodes.
| Total number of papers |
126,909,021 |
| Papers with zero references |
96,850,699 |
| Papers with zero citations |
89,647,949 |
| Papers with zero references and citations |
80,166,717 |
| Mean citation per paper |
4.17 |
| Mean citation per "connected" paper |
11.31 |
Table 5: Citation network statistics
It is not uncommon for research publications to never receive any citations [15]. In fact some studies estimate the proportion of publications which are never cited to be between 23% and 90% depending on the discipline [17, 7, 13]. Although it is possible for a research publication to not contain any references, we believe the proportion of such publications will be minimal, however we weren't able to find any study estimating what is the proportion of such publications. Furthermore, the approximate number of received citations per publication across all disciplines has been reported to be ≈ 11 [1].
These statistics show that although when we exclude the "disconnected" publications, the citation network is reasonably dense and the proportion of papers which don't have any outgoing edges in the network (references) is quite staggering. Furthermore, it is interesting to notice how the citation network provided in the MAG has been changing with each new version of the dataset. Microsoft has so far released four versions of the dataset (in May 2015, August 2015, November 2015 and February 2016). We have investigated the three latest versions. While the number of paper entities in the graph has remain relatively constant (with a growth from 122 million papers in August 2015 to 126 million papers in February 2016), the size of the citation network has been changing significantly — at first it grew from over 750 million edges to over 950 million edges, but has been reduced to 528 million edges in the latest version. While this shows Microsoft constantly keeps improving the dataset, these changes could also suggest potentially unreliable data.
In order to further study the properties of the citation network, we compared the citation data found in MAG with the Ranking Web of Universities [5] and the Scimago Journal & Country Rank (SJR) [4] citation data. The Ranking Web of Universities website aggregates institutional profiles found in Google Scholar to count the total citations received by a university. The website provides a list of top 2,105 universities around the world along with the aggregated citation counts. We used a version of the list published in December 2015. The Scimago website publishes journal ranks and total citation counts based on data obtained from Elsevier Scopus. The number of journals listed on the website is 22,878. The citation totals found on the Scimago website represent the sum of citations received by papers published in the journal over a three-year period. Specifically it is citations received in 2014 by the journal's papers published in 2011, 2012 and 2013.
We compared the MAG citation data with the external lists using two methods which complement each other. The methods are the size of the overlap of the lists and the Pearson's and Spearman's correlation coefficients. The overlap method ignores the ranks and counts how many items appear in both lists. The correlations are calculated only on the matching items.
To identify the common items in the MAG and the two external lists, we normalised the university and journal names (we removed all accents, special characters etc.) and tried to match the normalised names. We marked the names as matching only in those cases in which we identified a full string match. This way we were able to match 1,255 universities (out of 2,105 found on the Ranking Web of Universities website) and 13,050 journals (out of 22,878 found on the SJR website). We then counted total citations received by the university/journal in MAG (for journals, we limited the citations to the same time period as in the SJR data). Finally we ranked both lists (the MAG and the external data) and calculate the absolute difference between the ranks for each university and journal. Figure 5 shows a scatter plot of the university citation counts and Figure 6 a scatter plot of the journal citation counts.
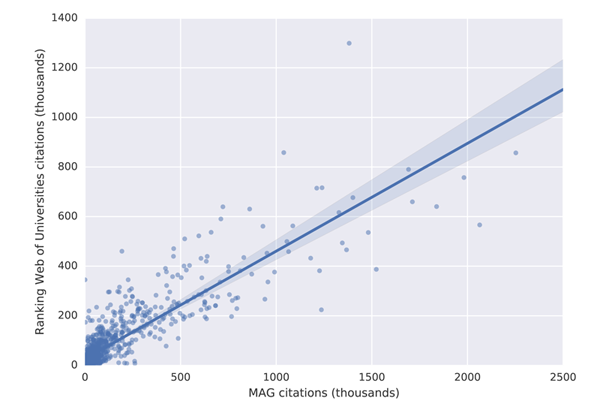
Figure 5: Comparison of university citations in MAG and on the Ranking Web of Universities website
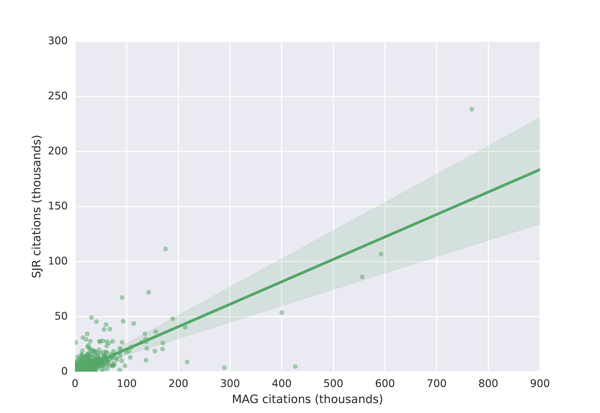
Figure 6: Comparison of journal citations in MAG and on the SJR website
We first compared the lists using overlap. When comparing the journal lists, we found 4 common journals in among the top 10, 54 among the top 100, 677 among the top 1,000 and 1,407 among the top 2,000. Table 6 shows the top 10 journals in both lists, with the journals appearing in both lists highlighted in bold.
| Rank |
MAG |
SJR |
| 1 |
Plos One |
Plos One |
| 2 |
Proceedings of the National Academy of Sciences |
Journal of the American Chemical Society |
| 3 |
Nature |
Nature |
| 4 |
Science |
Science |
| 5 |
Journal of Nanoparticle Research |
Physical Review Letters |
| 6 |
Journal of Biological Chemistry |
Chemical Communications |
| 7 |
Nanoscale Research Letters |
Journal of Biological Chemistry |
| 8 |
The New England Journal of Medicine |
Journal of Physical Chemistry C |
| 9 |
BMC Public Health |
Applied Physics Letters |
| 10 |
Cell |
Journal of Materials Chemistry |
Table 6: Top 10 journals according to the MAG and the Scimago Journal & Country Rank website. Highlighted in bold are those journals, which appear in both lists.
Unfortunately, we weren't able to produce a similar statistic for the universities lists because in the MAG, universities are mixed with other affiliations (research institutes, companies, etc.) in one table. For comparison we manually picked the first 10 universities according to their total citation counts found in the MAG and compared this list to the top 10 universities (in terms of total citation counts) according to the Ranking Web of Universities website. The two lists are shows in Table 7.
| Rank |
MAG |
Ranking Web of Universities |
| 1 |
Stanford University |
Harvard University |
| 2 |
University of Washington |
University of Chicago |
| 3 |
Massachusetts Institute of Technology |
Stanford University |
| 4 |
University of Michigan |
University of California Berkeley |
| 5 |
Johns Hopkins University |
Massachusetts Institute of Technology |
| 6 |
University of California Berkeley |
University of Oxford |
| 7 |
University of California |
University College London |
| 8 |
University of Texas at Austin |
University of Cambridge |
| 9 |
University of Wisconsin Madison |
Johns Hopkins University |
| 10 |
University of Toronto |
University of Michigan |
Table 7: Top 10 universities according to the MAG and the Ranking Web of Universities website. Highlighted in bold are those universities which appear in both lists.
There is one surprising difference in the table, which is the absence of Harvard University in the top 10 universities according to the MAG (in the MAG Harvard is at position 14) as Harvard University is know to be the most cited university. This is due to the fact that different Harvard schools appear in the MAG separately, for example
"Harvard Law School" and "Harvard Medical School" are listed as separate affiliations. We manually totaled all Harvard schools present in the MAG which moved Harvard University to the top of the list.
The other differences, particularly the different positions of universities in the two lists, are to be expected, as differences between different citation databases are know to exist. For example, when comparing Table 7 to the list of top universities provided by the Science Watch website [2] it can be seen that no two lists overlap exactly. The University of Washington, which is second in terms of total citations according to the MAG appears fourth in the Science Watch list but doesn't appear at all in the top 10 list according to the Ranking Web of Universities. The situation is similar for the journals [3].
To quantify how much the lists differ, we created histograms of the differences between the ranks in the MAG and in the external lists, which are shown in Figure 7. The blue coloured histograms show differences between the ranks of universities, while the green coloured histograms show differences between the journal ranks. To produce these histograms, we first sorted the data by the total citations provided in the external list (the Ranking Web of Universities and the SJR list). We then took the top 100 universities/journals with subplots (a) and (c) and the top 1,000 with subplots (b) and (d) and created a histogram indicating how much their ranks differ from ranks provided by the MAG.
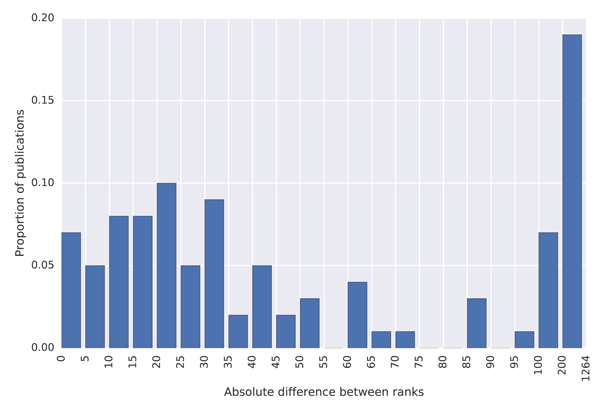
(a) Histogram of differences between ranks of the top 100 universities by the Ranking Web of Universities website and their ranks in the MAG.
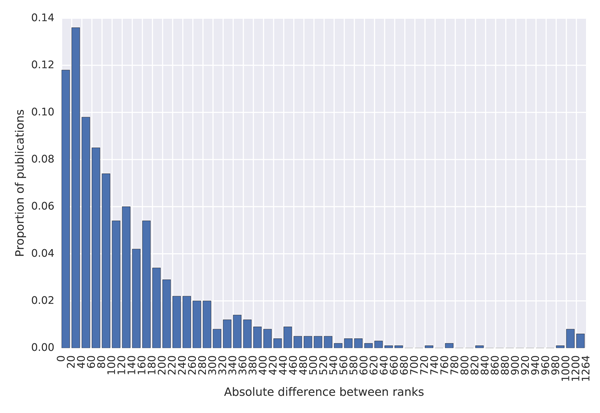
(b) Histogram of differences between ranks of the top 1,000 universities by the Ranking Web of Universities website and their ranks in the MAG.
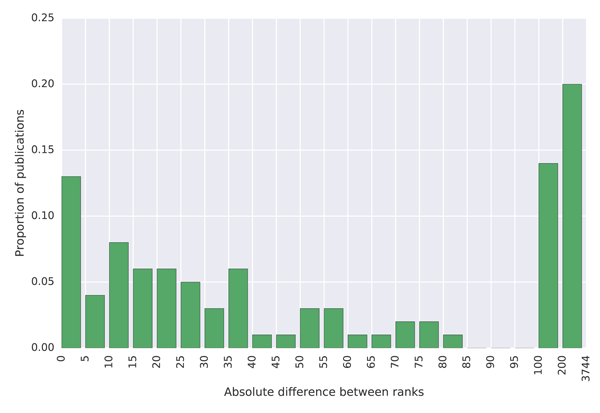
(c) Histogram of differences between ranks of the top 100 journals by the Scimago Journal & Country Rank website and their ranks in the MAG.
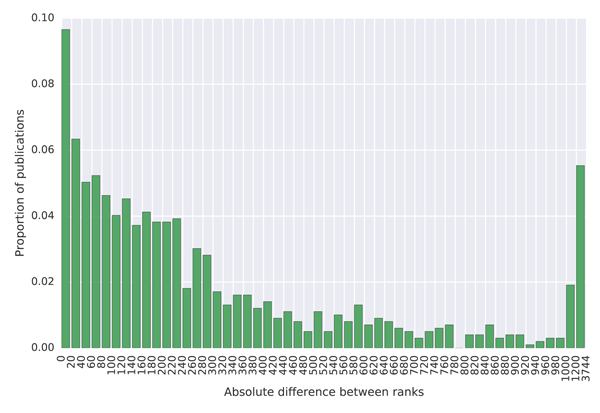
(d) Histogram of differences between ranks of the top 1,000 journals by the Scimago Journal & Country Rank website and their ranks in the MAG.
Figure 7: Histograms of differences between the ranks of universities and journals in the external lists and the MAG.
The results show that university citation rank in the MAG differs by more than 200 positions for about 20% of universities in the top 100 of the Ranking Web of Universities list. The citation university rank differs by less than 25 positions for less than 40% of universities across these two datasets. A similar situation is observed with journal ranks. This high discrepancy in rankings is not necessarily the problem of the MAG, but possibly of the reference lists which show lower absolute citation counts than those reported in the MAG. As it is possible to investigate the data at the granularity of individual citations in the MAG, which is not the case in the mentioned external lists, we believe that the MAG should be considered a more trustworthy source of data. The large differences in rankings produced by different providers indicate that a more transparent approach to releasing citation data, so that errors can be investigated and corrected, is necessary to establish authority.
The correlations are reported in Table 8. These were calculated only on the matching items. We found that, on average, the ranks in the two lists of top universities (number of items in the two lists is n = 1; 255) differ by 163, with standard deviation of 185. The Spearman's rho correlation for the universities lists is r = 0.8266 (p → 0), which is a strong correlation. In case of journals (n = 13,050), the ranks differ on average by 1,203 with standard deviation of 1,211. The journals lists also correlate strongly, with Spearman's r = 0.8973 (p → 0). These strong correlations confirm that although there are differences between the datasets, these are not significant, and the MAG can be used as a reliable source of citation data.
| |
Universities |
Journals |
| Pearson's r |
0.8773, p → 0.0 |
0.8246, p → 0.0 |
| Spearman's rho |
0.8266, p → 0.0 |
0.8973, p → 0.0 |
Table 8: Correlations between the MAG and the top universities list obtained from Ranking Web of Universities website and the journals list obtained from the SJR website.
4 Discussion and Conclusions
In this paper we investigate the Microsoft Academic Graph, a large heterogeneous graph comprised of over 120 million publications, the related authors, institutions, venues and fields of study and relations between these entities. In this paper, we reported on the analysis of the MAG as compared to other research publication and citation datasets. While the MAG data correlate well with external datasets and are a great resource for doing research in scholarly communication, we identified certain limitations as to the completeness of links from publications to other entities. However, despite the limitations, the MAG is currently the most comprehensive publicly available dataset of its kind and represents an astonishing effort which will prove useful in many areas of research where full text access to publications is not required. The MAG is also an important step in the right direction in terms of releasing free and open citation data for research evaluation purposes. We showed that existing university and journal rankings, which are typically based on proprietary aggregated data, produce substantially different results. This diminishes the trust in these rankings.
Because the MAG is open and transparent at the level of individual citations, it is possible to verify and better interpret the citation data. We believe our analysis will be valuable to those deciding whether to use the MAG and for what purposes, how to avoid pitfalls, and how to interpret the results.
References
| [1] |
Citation averages, 2000-2010, by fields and years. |
| [2] |
Science Watch: The Most-Cited Institutions Overall, 1999-2009. |
| [3] |
Science Watch: Top Ten Most-Cited Journals (All Fields), 1999-2009. |
| [4] |
Scimago Journal & Country Rank.
|
| [5] |
Ranking Web of Universities, 2015. |
| [6] |
B. M. Althouse, J. D. West, C. T. Bergstrom, and T. Bergstrom. Differences in Impact Factor Across Fields and Over Time. Journal of the American Society for Information Science and Technology, 60(1):27-34, 2009. http://doi.org/10.1002/asi.20936 |
| [7] |
M. Bauerlein, M. Gad-el Hak, W. Grody, B. McKelvey, and S. W. Trimble. We must stop the avalanche of low-quality research. The Chronicle of Higher Education, 13, 2010. |
| [8] |
D. Castelvecchi. Physics Paper Sets Record with More than 5,000 Authors. Nature News, pages 14-17, 2015. |
| [9] |
C. A. D'Angelo and G. Abramo. Publication Rates in 192 Research Fields of the Hard Sciences. In Proceedings of the 15th ISSI Conference, pages 915-925, 2015. |
| [10] |
V. Henning and J. Reichelt. Mendeley — A Last.fm for research? Proceedings — 4th IEEE International Conference on eScience, eScience 2008, pages 327-328, 2008. http://10.1109/eScience.2008.128 |
| [11] |
D. Herrmannova and P. Knoth. Semantometrics: Fulltext-based Measures for Analysing Research Collaboration. In Proceedings of ISSI 2015 Istanbul: 15th International Society of Scientometrics and Informetrics Conference, Istanbul, Turkey, 2015. |
| [12] |
P. Knoth and Z. Zdrahal. CORE: Three Access Levels to Underpin Open Access. D-Lib Magazine, 18(11/12), 2012. http://doi.org/10.1045/november2012-knoth |
| [13] |
L. I. Meho. The rise and rise of citation analysis. Physics World, 20(1):32, 2007. |
| [14] |
M. E. J. Newman. Coauthorship networks and patterns of scientific collaboration. Proceedings of the National Academy of Sciences of the United States of America, 101(1):5200-5205, 2004. |
| [15] |
P. O. Seglen. The Skewness of Science. Journal of the American Society for Information Science, 43(9):628-638, 10 1992. http://doi.org/10.1002/(SICI)1097-4571(199210)43:9<628::AID-ASI5>3.0.CO;2-0 |
| [16] |
A. Sinha, Z. Shen, Y. Song, H. Ma, D. Eide, B.-j. P. Hsu, and K. Wang. An Overview of Microsoft Academic Service (MAS) and Applications. In Proceedings of the 24th International Conference on World Wide Web, pages 243-246, Florence, Italy, 2015. ACM Press. |
| [17] |
A. R. Weale, M. Bailey, and P. A. Lear. The level of non-citation of articles within a journal as a measure of quality: a comparison to the impact factor. BMC Medical Research Methodology, 14(4), 2004. http://doi.org/10.1186/1471-2288-4-14 |
About the Authors
Drahomira Herrmannova is a Research Student at the Knowledge Media Institute, Open University, working under the supervision of Professor Zdenek Zdrahal and Dr Petr Knoth. Her research interests include bibliometrics, citation analysis, research evaluation and natural language processing. She completed her BS and MS degrees in Computer Science at Brno University of Technology, Czech Republic. Aside of her PhD she participated in research projects at the Knowledge Media Institute (CORE, OU Analyse).
Petr Knoth is a Senior Data Scientist at Mendeley, where he develops text-mining tools to help researchers' workflows. Dr Knoth is also the founder of the CORE system, which aggregates millions of open access publications from repositories and journals and makes them freely available for text-mining. Previously, as a researcher at the Open University, he acted as the principle investigator on a number of national and international research projects in the areas of Text Mining and Open Science.