 |
D-Lib Magazine
September/October 2013
Volume 19, Number 9/10
Table of Contents
Exploring Research Trends with Rexplore
Francesco Osborne and Enrico Motta
Knowledge Media Institute, The Open University
{f.osborne, e.motta}@open.ac.uk
doi:10.1045/september2013-osborne
Printer-friendly Version
Abstract
Current systems for exploring scholarly data exhibit a number of shortcomings in their ability to facilitate the identification of research trends and identify 'interesting' connections between researchers. To address these issues we have developed Rexplore, a novel system which combines statistics, human-computer interaction, and semantic technologies, to support knowledge-based exploration and visualization of scholarly data. In this paper we focus on the functionalities provided by Rexplore for visualizing research trends and we use as an example research in "Social Networks", which has experienced dramatic growth in the years 2000-2010.
Keywords: Algorithms, Performance, Design, Experimentation, Human Factors, Scholarly Data, Bibliographic Data, Data Visualization, Data Exploration, Visual Analytics, Semantic Technologies
1. Introduction
Current systems for exploring scholarly data exhibit a number of shortcomings in their ability to facilitate the identification of research trends and identify 'interesting' connections between researchers. In particular, we miss integrated solutions [1], able to go beyond the standard author/publication search paradigm and provide an integrated suite of visualizations and analytical tools, able to support users not just in locating specific people/publications but also in making sense of the wider trends in research. While there are many reasons why current systems fail in this respect, a specific limitation affecting all existing systems is that they lack a notion of research area characterized as a 'first-class citizen' and by and large focus on keywords associated with documents. As a result, these systems introduce noise (not all keywords associated with papers are research areas, e.g., "case study"), and also fail to take advantage of the relations which exist between research areas (e.g., area A being a sub-area of area B, or multiple keywords being used to refer to the same area). Another problem concerns the ability to identify connections between authors, which usually only include co-authorship and co-citation and miss interesting relations, such as identifying groups of people who follow similar research trajectories.
To address these issues we have developed Rexplore, a novel system which combines statistics, human-computer interaction, and semantic technologies, to support knowledge-based exploration and visualization of scholarly data. In this paper we focus in particular on the support provided by Rexplore for analyzing research trends. Unlike most current systems, Rexplore characterizes topics as semantic entities which can have a number of relationships with other topics [2]. (Note that we use the terms 'topic' and 'research area' interchangeably.) Building on this knowledge base, it offers a set of integrated tools which can be used to analyze topics at different levels of granularity and to visualize research trends. Rexplore also includes a powerful graph view for exploring connections between authors, including novel similarity metrics which take into consideration the research trajectory of an author.
2. Related Work
Many systems allow for the visualization of topic trends on a timeline. Arnetminer [3] offers the possibility of visualizing the topics an author mostly published in and the "temporal interest", that is the shifting of an author's interest during her/his career. However, topics include many keywords that arguably are not research areas (e.g., conferences names) and the absence of a hierarchical structure makes it hard to discriminate coarse-grained topics from fine-grained ones. Microsoft Academic Search (MAS) [4] allows users to plot an area chart in which different keywords are compared in terms of the number of related publications. It lacks, however, the ability to focus on finer grained topics and the keyword set suffers from noise.
Extracting topics from academic repositories is an interesting challenge that has been addressed with a range of different techniques [5-10]. Probabilistic Topic Models [5] consider topics as semantically related probabilistic clusters of words in text corpora, which are often detected by means of Probabilistic Latent Semantic Analysis [6] or Latent Dirichlet Allocation [7]. The CORE system [8] exploits a semantic enrichment procedure to harmonize and enrich document metadata and makes it possible to estimate the semantic relatedness between two textual fragments. Instead, Rexplore uses the Klink Algorithm [2] (discussed in Section 3.1), which, differently from the aforementioned methods, outputs a fully-populated OWL ontology, enabling a fine-grained topic analysis. Yang et al. [9] derive topic trends in computer science from papers in the DBLP database by employing a clustering algorithm on the citation network. This technique, however, does not allow the detection of semantic relationships between topics. Fukuda et al. [10] propose a method for automatically creating trend maps from papers, but which needs human users to manually label the documents.
The data visualization community has also produced several tools for highlighting topic trends. The FacetLens system [11] exploits a faceted paradigm to generate advanced visualizations of trends and relationships. It can filter academic publications according to metadata as authors, venues and topics and show the results on a timeline. Rexplore uses a similar paradigm for managing the queries and allows logical conjunctives to combine some of the facets. However, it also supports advanced browsing and trend visualization for authors and topics. Herrmannova and Knoth [12] proposed a novel visual search interface which allows users to compare and contrast properties of multiple documents as topics, references and authors and to browse documents using their semantic similarity. Likewise, Rexplore exploits semantic relationships between authors and topics to improve data navigation. Another interesting tool is BiblioViz [13], which provides highly customizable table-based and network-based visualizations, supporting several different layout algorithms. Rexplore offers a lower number of visualizations, as it focuses primarily on supporting the interactive analysis of data in an integrated environment.
3. Detecting Topic Trends
Rexplore integrates a variety of data sources including: Microsoft Academic Search, DBLP++, DBpedia, GeoNames, and other external information parsed from a variety of web sites. As of June 2013, it integrates metadata from about 20 million papers and 2 million authors. The Rexplore back-end is implemented in PHP, while the interface and the visualizations are in HTML5 and JavaScript. The plots use the Highcharts library, while the graph view exploits a modified version of Jit.
3.1 Topic Analysis and Evolution
The MAS and DBLP++ datasets conveniently associate a set of keywords to each document. However, using these keywords as research topics brings a number of problems. In fact, automatically extracted keywords are usually noisy and may include strings that are not research areas at all. Thus, an initial problem is how to filter out any string that is not a topic. In other datasets the keywords are chosen directly by the authors and as a result tend to be cleaner, but this manual annotation can also introduce problems, as the human-chosen keywords are usually fewer than the ones automatically extracted from a publication and tend to mix different levels of granularity. Moreover, different authors can label a similar paper in different ways. In both cases if a keyword is too abstract (e.g., Artificial Intelligence) it is not very informative, while if it is too low level it is of limited value, unless we can relate it to a coarser-grained topic. To solve this second problem it is possible to adopt a classification like ACM and label a paper with a mix of low level topics and their super-topics. Unfortunately these manually produced classifications tend to be rather shallow, fail to include the fine-grained topics on which research normally focuses, and evolve too slowly to keep up with the dynamics of research.
Rexplore addresses these problems by using an automatically generated knowledge base, describing over 1000 topics structured by three semantic connections: skos:broaderGeneric (describing the sub-topic relationship), contributesTo (topic T1 contributes to research area T2 but it is not its sub-area) and relatedEquivalent (two topic labels refer to the same research area) [2]. Our ontology model extends the BIBO ontology, adding the relatedEquivalent and contributesTo object properties described earlier, and the class Topic. The ontology is populated and updated by means of Klink [2], a novel algorithm which exploits machine learning methods, stochastic techniques and external knowledge to infer semantic relationships between keywords. Klink first filters out keywords that are not topics, using external knowledge parsed from Wikipedia, Google Scholar and EventSeer. It then identifies hierarchical and similarity links between topics, thus constructing an extensive hierarchical structure. The totally automatic algorithm ends when no more keywords are to be merged and the hierarchical structure appears to contain no noise. Finally, a set of heuristic rules which take into account the temporal relationships among keywords are used to derive the three semantic relations mentioned before and a knowledge base expressed in OWL is produced.
Rexplore exploits the knowledge base by labeling with topic T1 a publication tagged with topic T2, if T2 is broaderGeneric or relatedEquivalent to T1. When a user searches for publications about "Digital Library" Rexplore will find also papers that are tagged with a spectrum of keywords that are indeed related, e.g., "Digital Documents". The amount of data available for each topic is thus greatly increased: for example, as of September 2013 the Rexplore database includes 22,523 publications tagged with the string "Artificial Intelligence", while the publications regarding the topic "Artificial Intelligence" number 106,052. This knowledge base can then be exploited to analyze author interests at different levels of abstraction. For example, it is possible to look at the coarse-grained interests of an author (e.g., "Semantic Web", "Digital Library") even if they are seldom directly cited in her/his publications and then to zoom on one of them (e.g., "Semantic Web") to explore her/his interest in specific sub-topics (e.g., "Linked Data", "Semantic Web Services", etc.).
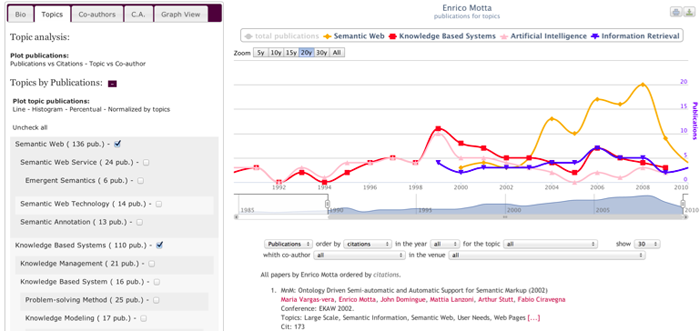
Figure 1: Enrico Motta's topics of interest on a timeline.
Topics can be plotted against a timeline to follow the shift of interests of an author. For example Figure 1 shows Enrico Motta's main topics and highlights how in the first part of his career, he worked in "Artificial Intelligence" and "Knowledge Base Systems", but from 2003 he focused primarily on "Semantic Web" research. By selecting the hierarchical list on the left it is possible to change the granularity level, to view the the sub-topics of each research area. It is also possible to examine an author's performance in a topic, say T, by comparing it with the average for T.
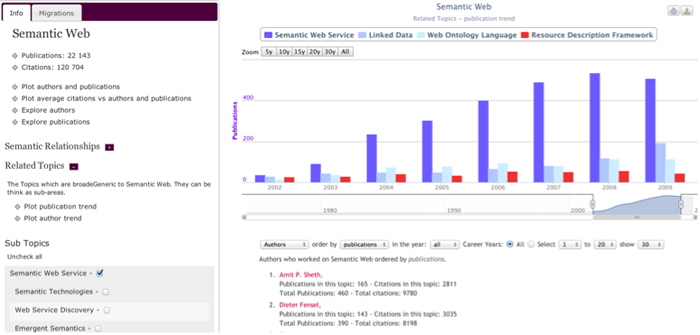
Figure 2: Topic analysis tool focused on the "Semantic Web" area. The histogram shows the publication trends of a number of sub-topics.
Rexplore allows users to compare in the same chart the trends of related topics. For example, Figure 2 shows the publication trends of selected sub-areas of the Semantic Web, allowing the user to see which parts of Semantic Web are growing or declining.
In fact, research areas are very dynamic: new topics are introduced all the time and can experience dramatic growth, while others may decline. Authors determine these trends, migrating from one topic to another. For this reason, Rexplore also visualizes migration patterns across areas, allowing users to understand which areas people working in a new area are coming from, and whether an area is either growing or shrinking, i.e., whether there is a gain or loss of researchers between two areas. Rexplore provides three metrics that can be plotted on a timeline to make sense of the author movements.
The first one is the flow metric of authors from area T1 to area T2, that is, the number of authors that were working in area T1 and then started to work in area T2.
The second is the migration metric, which is an estimation of the number of authors that leave area T1 for area T2. A naive way to compute it would be to consider only the case in which an author actually stops working in T1 in a reasonable time span after starting to work in T2. However the initial experiments proved this method to be too coarse-grained; in fact, often authors do not migrate completely but instead reduce their involvement in T1 while increasing it in T2. We adopted a more incisive way to detect migration events, which takes into consideration the concept of major area. We consider topic T a major area for an author if in the last 3 years she/he has at least 20% of her/his publications in T and her/his production is equal or superior to the average publications/year in this field. The other areas are considered minor areas. A migration event is defined as a shift between minor and major areas. More formally, we consider migration from T1 to T2 to occur when the author's publications for major area T1 decrease at least by 50%, downgrading T1 to a minor area, while at the same time, the papers published in the minor area T2 increase at least by the same amount, upgrading T2 to a major area. We consider as actual migrations only the transitions that happen in a time span equal to or less than 5 years. The number of migrations computed with this approach is an underestimation of the number of authors who migrate from one area to another, but has proved to be very useful in detecting trends.
The third metric is the migration balance, which is the difference between the migration from T1 to T2 and the migration from T2 to T1. It is in fact useful to distinguish the case in which two areas are exchanging a number of authors but maintaining a balance, from the case in which one area is being depleted for another.
3.2 Graph View
The graph view of Rexplore was devised to provide an interactive and flexible tool for supporting expert search in the academic domain and allowing users to visualize a variety of relations between authors. It offers:
- Different metrics for ranking and relating authors;
- A navigation system which allows users to seamlessly explore the graph as a map;
- An environment which permits analyzing and visualizing the details of an author or a relation; and
- A set of filters on both authors and relations.
The graph view takes as input a single or a set of authors and shows their connections allowing the user to choose among a variety of links, ranking and filters. It offers six metrics for defining the links: co-publication, co-citation, publication pattern similarity, citation pattern similarity, topic similarity and temporal topic similarity. The last two are computed as variation of the cosine similarity which exploits the topic ontology and the timestamp of the papers.
The graph in Figure 3 shows the authors that are the most similar to some of the major authors in the Digital Library area, based on the similarity of their topics of interest. The thickness of a link and its color represent the strength of the connection (e.g., how similar are two authors according to the topic similarity) and the diameters of the node indicate rank (e.g., number of publications in the Digital Library area). By clicking on a node or a connection it is possible to obtain information about that author or connection. After the graph is plotted, a user can modify and explore it as a map, folding and unfolding portions of it.
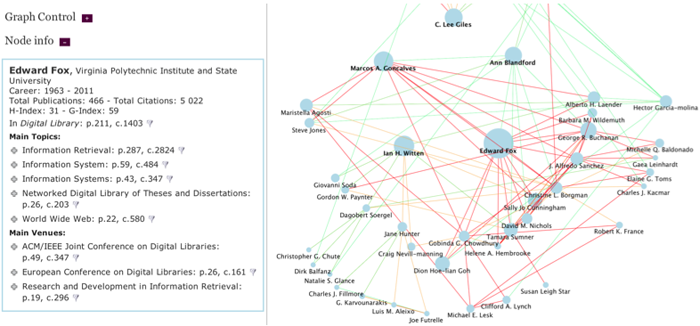
Figure 3: Graph View showing the most similar authors (with respect to topics of interest) to some of the major authors in the "Digital Library" field.
This tool is particularly useful in the exploration of the semantic enriched topics. In fact, by visualizing the main authors in a field and their connections in terms of co-authorships, topic similarity or career trajectory, it is possible to obtain a snapshot of the main research directions and the top experts. The graph view allows selecting a context, a set of topics or venues, and using them for ranking the graph nodes or filtering the graph links. For example, by using "Digital Library" as the context, it is possible to rank the nodes by the number of citations in this field and to show only nodes related to this topic. When using the co-publications or the co-citations as links, it is also possible to select only collaborations about selected topics or venues. This highlights the various networks author collaborations in different topics, and their overlapping components.
4. A Scenario: Analysis of the Social Network Explosion
In this section we discuss a scenario that shows how the different features of Rexplore come together for analyzing the dynamics of a research topic. We take as an example the "Social Networks" area in the years 2000-2010, an interesting case study because of its recent growth. First, we can look at the topic's number of authors, publications and average citations on a timeline. We can see that the interest in "Social Networks" has risen almost exponentially, especially after 2005, which is the year when Facebook was launched outside the USA. It should be noted that these data include not only papers associated with the "Social Networks" string, but also those tagged with any sub-topics of the "Social Networks" area, including "Social Web", "Social Media", "Collaborative Networks", "Community Detection", "Social Network Theory", etc.
Next, we can see which researchers migrated to "Social Networks" to foster its explosion. Figure 4 shows the migration balance, and highlights that until 2006 the authors were mainly from the "Word Wide Web" area; after the explosion something changed and people from "Knowledge Base", "Information Retrieval" and "Data Mining" started to flow in. We can theorize that in that period of time researchers started to acknowledge that "Social Networks" could be a good area in which to employ their expertise in mining and managing complex data.
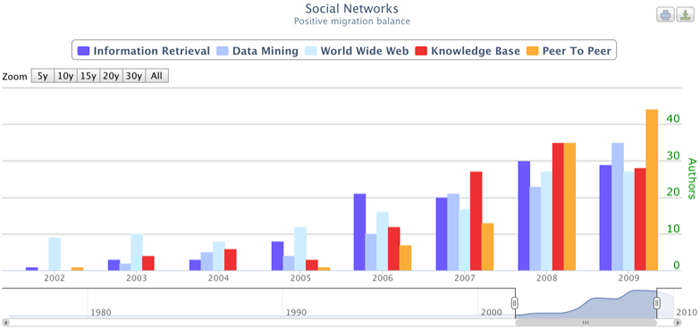
Figure 4: Migration balance of the "Social Networks" area.
We can get more information about the main authors and their groupings in this transition period by using the graph view. For example, Figure 5 is a graph showing the main authors that worked on both "Data Mining" and "Social Networks". The user is investigating the collaboration between two of those authors.
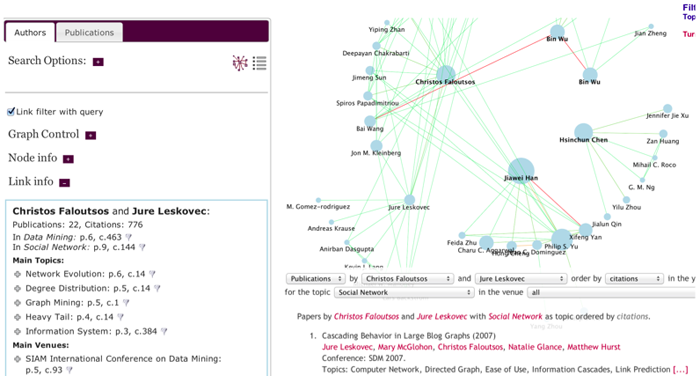
Figure 5: Exploring the collaboration network of authors who work on both "Social Networks" and "Data Mining".
Another intriguing question to answer is which sub-topics of "Social Networks" helped to foster the growth. Was a new area born? Or was it simply that some existing topics suddenly enjoyed a burst of interest? Figure 6 answers the question by showing the trends of some of the main sub-topics of "Social Networks". The "Network Analysis" area was excluded from the plot since its growth is out of scale and would flatten out the other values. We can see that many new topics acquired importance after 2006. The most important of those is "Social Media". In only five years it grew to exceed 400 publications per year. In fact, the large amount of information produced by the users of social networks represented a true goldmine for computer scientists and an excellent test case for experts in "Data Mining". Some other topics, such as "Community Detection" and "Link Prediction", also enjoyed a renewed interest in this period.
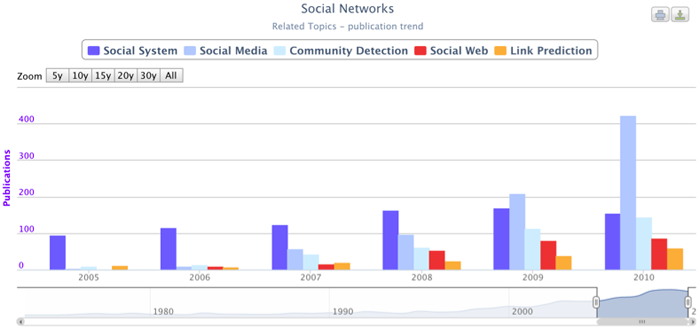
Figure 6: Trends concerning sub-topics of the "Social Networks" area.
5. Conclusion
The current version of Rexplore includes many interesting features for making sense of topic trends and migrations, and we are planning system enhancements on a number of fronts, incorporating feedback from an extensive user evaluation. Future work includes building novel visualizations that will intuitively show the relationships among groups of authors in addition to individuals. We are developing stochastic techniques for foreseeing topic and author trends. Finally, we plan to develop and employ innovative methods for improving the quality of the data, in particular, to reduce errors resulting from homonymy between authors, and even between different topics.
References
[1] Dunne, C., Shneiderman, B., Gove, R., Klavans, J., and Dorr, B. 2011. Rapid Understanding of Scientific Paper Collections: Integrating Statistics, Text Analytics and Visualization. Computational Linguistics, 1—31.
[2] Osborne, F. and Motta, E. 2012. Mining semantic relations between research areas. International Semantic Web Conference (ISWC 2012), 410—426, Springer.
[3] Tang, J., Zhang, J., Yao, L., Li, J., Zhang, L. and Su, Z. 2008. ArnetMiner: extraction and mining of academic social networks. Knowledge Discovery and Data Mining Conference (KDD) 2008, pp. 990—998.
[4] Jacsó, P. 2011. The pros and cons of Microsoft Academic Search from a bibliometric perspective. Online Information Review, 35(6), 983—997.
[5] Daud, A., Li, J., Zhou, L. and Muhammad, F. 2010. Knowledge discovery through directed probabilistic topic models: a survey. Frontiers of computer science in China, 4(2), 280—301.
[6] Hofmann T. 1999. Probabilistic latent semantic analysis. In UAI '99: Proceedings of the 15th Annual Conference on Uncertainty in Artificial Intelligence, Stockholm, Sweden.
[7] Blei, D. M., Ng, A. Y. and Jordan, M. I. 2003. Latent dirichlet allocation. Journal of Machine Learning Research, 3: 993—1022.
[8] Knoth, P. and Zdrahal, Z. 2012. CORE: three access levels to underpin open access. D-Lib Magazine, 18(11), 4. http://doi.org/10.1045/november2012-knoth
[9] Yang, Y., Chawla, N. V., Lu, X. and Adali, S. 2013. Prominence in Networks: A Co-evolving process. IEEE 2nd International Network Science Workshop (NSW 2013), West Point, NY, USA.
[10] Fukuda, S., Nanba, H. and Takezawa, T. 2012. Extraction and Visualization of Technical Trend Information from Research Papers and Patents. D-Lib Magazine, 18(7). http://doi.org/10.1045/july2012-fukuda
[11] Lee, B., Smith, G., Robertson, G.G., Czerwinski, M. and Tan, D. S. 2009. FacetLens: exposing trends and relationships to support sensemaking within faceted datasets. In: Proceedings of ACM CHI 2009 Conference on Human Factors in Computing Systems, 1293-1302.
[12] Herrmannova, D. and Knoth, P. 2012. Visual search for supporting content exploration in large document collections. D-Lib Magazine, 18(7). http://doi.org/10.1045/july2012-herrmannova
[13] Shen, Z., Ogawa, M., Teoh, S. T. and Ma, K. L. 2006. BiblioViz: a system for visualizing bibliography information. In: Proceedings of APVIS 2006, Asia Pacific Symposium on Information Visualisation. Volume 60 (pp. 93-102). Australian Computer Society.
About the Authors
 |
Francesco Osborne is a Research Assistant at the Knowledge Media Institute of The Open University and a PhD student in Computer Science at the University of Torino. His research interests include Semantic Web, User Modeling, Information Retrieval on Social Networks and Storytelling. He designed and implemented tools which exploit machine learning and semantic technologies for user modeling, data exploration and trend detection.
|
 |
Enrico Motta has a PhD in Artificial Intelligence and is Professor of Knowledge Technologies at the Knowledge Media Institute of The Open University. He is the author of more than 280 refereed publications and his h-index is 50. Currently, much of his research focuses on the design and implementation of innovative user-centric solutions, which are able to leverage the very large amounts of data that are now available online, using hybrid methods that typically integrate language, semantic and machine learning technologies. In particular, he is working on a novel tool, which supports the exploration of scholarly data to facilitate trend analysis and expert search in academia, and to allow users to discover interesting relations and similarities between authors. Prof. Motta is Editor-in-Chief of the International Journal of Human-Computer Studies, which is ranked as the top journal in HCI by Microsoft Academic Search. He is also a member of the Editorial Boards of the Journal of Web Semantics and IEEE Intelligent Systems. In 2003 he founded the International Summer School on Ontology Engineering and the Semantic Web, which is now in its 10th edition. Prof Motta is a member of the Management Committee of the Semantic Web Science Association (SWSA) and has advised strategic research boards and governments in several countries, including the US, UK, The Netherlands, Austria, Finland, and Estonia. Together with Tom Heath he won the Semantic Web Challenge at the 2007 International Semantic Web Conference and, in collaboration with members of his research group, he won the best paper award at the 2008 and 2009 Asian Semantic Web Conferences.
|
|