|
Search | Back Issues | Author Index | Title Index | Contents |
![]()
D-Lib Magazine
|
|
|
Jeffrey N. Gatten Tom Sanville |
![]()
|
The struggle to find cost-effective alternative approaches to scholarly publishing resulting in a meaningful change to funding models—as opposed to simply reshuffling the funding deck—continues in full force. One debate within this larger context centers on the merits of the Big Deal, which is "any online aggregation of e-content that a publisher, aggregator, or vendor offers for sale or lease at prices and/or terms that substantially encourage acquisition of the entire corpus" (Peters 2001). One problem with any discussion of the Big Deal is how widely the concept is defined from one environment to the next, often creating an "apples to oranges" debate on the benefits and threats the Big Deal presents. For purposes here, the Big Deal is defined from the consortium perspective, meaning the subscription and purchase of full sets of publishers' journals in electronic format and the provision of access to member institutions. The purchase is a negotiated contract for a fixed period of years (typically three years) and at fixed rates of cost increases (usually well below the increases on the open market). For a thorough review of the issues and dilemmas for libraries surrounding the Big Deal model, there are two required readings. First, Kenneth Frazier, writing an opinion piece published in D-Lib Magazine (Frazier 2001), uses game theory to criticize the Big Deal on the grounds that information providers employ "enhanced loyalty," "disintermediation," and "changing the rules" to "weaken the power of librarians and consumers to influence scholarly communication systems in the future." Second, the immediate following issue of D-Lib Magazine (April 2001) contained several letters to the editor taking exception to Frazier's remarks. Most notably, a lengthy letter from the leadership within OhioLINK defends the consortium's engagement in numerous Big Deals and cites benefits gained through negotiations with scholarly journal publishers. Perhaps the most controversial aspects of the Big Deal are the "all or nothing" approach requiring a library or consortium to purchase a single package of all journal titles available electronically from a publisher and the "one way street" of a contracted financial commitment over multiple years. Problems arise when libraries need to make decisions about managing static or shrinking budgets while large percentages of those budgets are committed to multi-year Big Deal agreements. Wouldn't it be easier and less expensive to purchase only those titles from a publisher that serve one's users? Yet, OhioLINK's experience with the Big Deal demonstrates traditional title-by-title selection decisions amount to rationing information to our users. An OhioLINK-defined "Big Deal" for electronic journals meets several criteria. First, it includes a group of libraries of which some subscribe to one or more of the given publisher's print titles. There also may be some libraries in the group with no print subscriptions. Second, the titles made available to the group electronically will exceed the number to which any given library subscribes and may include titles to which none of the libraries subscribe in print or electronic form. Third, constituents of each library have access to the same expanded set of the publisher's titles. OhioLINK's Big Deals cover all but seven of its eighty-five member institutions. Given the diversity of OhioLINK's membership, it is not uncommon for small institutions to have few or none print or electronic subscriptions prior to a Big Deal, making almost all the journals resulting from a Big Deal new to our community and liberal arts colleges. For the major commercial publishers, OhioLINK universities' existing print subscriptions typically range from 10% to 55% of a publisher's title list, with the average being only 20% to 25% coverage. OhioLINK Big Deals typically license 100%, or very close to it, of a publisher's title list, meaning an average of 75% to 80% of the titles are new to each university. Each university's patrons use 70% to 95% of the available Big Deal titles. Furthermore, it is typical for the 15% to 35% of Big Deal titles that were not previously held by any library within OhioLINK to be actively used. These dynamics of prior and new access are critical in considering how one constructs a mechanism allowing a Big Deal to shrink based on economical need. For a single institution licensing electronically what it already has in print, or where there has been a specific incremental charge for each new title, it is logical and practical to simply compare the cost-versus-use on a title-level basis. Those titles deemed to be of low value might then be discontinued to save the associated costs. But what about a Big Deal where titles received were never held by anyone in the consortium and where the majority of titles used on any one campus were never held in print at that institution? How is a title deleted under a consortium Big Deal constructed without a campus-by-campus selection basis? The nice neat ownership, use, and cost associations that might work for a single institution no longer work in a consortium Big Deal. The institutional associations are superseded by group dynamics in which benefits to the participating libraries are substantially increased and the available collection departs dramatically from the traditional title-by-title subscriptions held by each. A departure is required from past practice to create an orderly retreat or attrition mechanism, allowing for incremental changes in the Big Deal's set of titles, for both the consortium members and the publisher. One needs to recognize that what is being delivered and used departs significantly from traditional individual institutional practice. An orderly retreat must recognize that once the consortium and publisher agree on a collective price and a broad collection of titles, the usefulness of institutional traditional cost-per-journal analyses proves inadequate. Electronic access stimulates a great deal of use both on titles previously available in print and those not previously held. The Big Deal's intent and impact is to create a new cohesive group collection and economic relationship that supersede individual institutional relationships with publishers. We now have a much more concrete measure of relative value, which is the number of uses (downloads). While sheer volume of use (i.e., cost-use analysis) is not the only measure of value, to fail to recognize use as the dominant starting point is to deny reality. Assuming the Big Deal is deemed a reasonable and cost effective approach to expanding access to scholarly information because it demonstrates that title-by-title collection development selections do not adequately address user needs, then what is to be done when the financial commitment to the Big Deal is no longer sustainable? OhioLINK has worked with a growing number of publishers to build into Big Deal licenses a mechanism allowing for the incremental attrition of content and annual cost without bringing the relationship to a crisis or destroying the essential benefits to both parties. The mechanism's design reinforces the concept of the Big Deal as a means to access the maximum affordable publisher's content. The mechanism simply allows for an annual reduction from the next year's planned value of the license by an amount equivalent to the percentage of use that titles selected for discontinuation represent. For example, discontinued electronic access to titles representing 2% of the use will result in a reduced value of the group license by 2%. This reduced value then becomes the new basis on which future annual license increases are calculated. The mechanism can be used before the start of each subscription year, based on the latest annual active title usage distribution. The mechanism also has a reverse provision that provides the cost schedule to reinstate receipt of current issues and back files of previously discontinued titles. Easily compiled use data should make cost-use analysis a relatively simple process for enacting the mechanism. However, a difficult scenario develops for a consortium because member libraries create different use patterns depending on curricula, research agendas, strengths of selected academic programs, Carnegie classifications, etc. Research QuestionAre use patterns of titles within a Big Deal similar across a consortium's member institutions to allow for an orderly (title-by-title) aggregate retreat without disenfranchising one or more member institutions? Analysis of OhioLINK and the Big DealThe OhioLINK consortium has collected several years of use data, institution by institution, for its Big Deal journal collections. Use data is defined as total article downloads per title. With this data, it is possible to determine in the aggregate which titles of a Big Deal are used consistently less often and, thus, the impact of an orderly retreat on member libraries. For example, a matrix can be created where each row represents one electronic journal title provided from a publisher. Each one of twelve columns represents a university. The intersect of row and column contains the total number of article downloads over a fixed period of time. Table 1 illustrates the matrix for one of OhioLINK's Big Deal publishers (using total downloads from 2000 to 2003 inclusive), but the analysis can be applied to any of OhioLINK's Big Deal publishers with very similar results. Data from OhioLINK's thirteen major universities is used here for illustrative purposes (there are a total of seventy-eight member institutions participating in OhioLINK Big Deals) and accounts for over 80% of all article downloads within the consortium. The remaining <20% of use is scattered across the scores of remaining institutions of community colleges, private colleges, and medical schools, such that the thirteen major universities drive any type of aggregate analysis. Table 1. Partial matrix for consortium Big Deal "use analysis" for a single publisher (Publ-A).
In Table 1, the far right column labeled TOTAL provides the aggregate number of articles downloaded by the consortium for each title. Using the TOTAL column, the titles are sorted into a ranked order by total use (i.e., article downloads), from highest (1) to lowest (417). The complete data for each institution, of which only a sample is provided in Table 1, also can be used to determine how closely one institution's ranked order of titles by use correlates with another institution's ranked order. Using statistical software such as SPSS, one can calculate the Spearman's correlation coefficients to determine the strength of the relationship of the ranked orders. In other words, one can find how the rankings of journal titles by use are similar or different for all consortium members. The higher the correlation, the more suitable the aggregate use data for making an orderly retreat from the Big Deal. Table 2 indicates relatively strong correlations in the rank orders among the universities, with the average correlation between any two institutions falling between .59 and .69. Table 2. Rank-ordered correlations (using Spearman's rho)
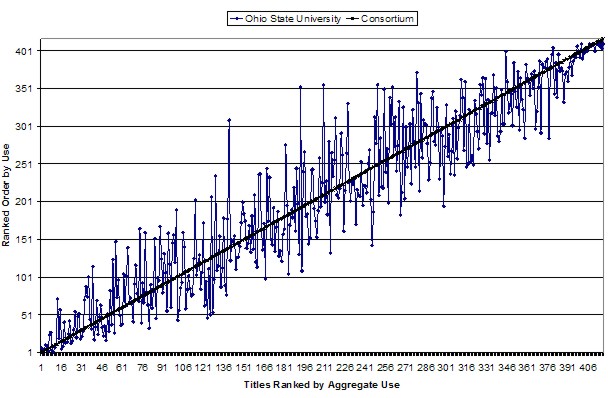
Within the consortium, an individual institution's ranked use data can be plotted against the aggregate use data in order to examine similarities or differences. Chart 1 shows a straight line from the bottom left to the upper right representing the ranked order of titles by aggregate (total consortium) use. Imposed on the grid is the ranked-order-by-use information from one OhioLINK institution, in this case Ohio State University (OSU). OSU's ranked use data follows the general trajectory of the aggregate data, with a few noticeable exceptions. The parallel between the aggregate plot and the OSU plot is not too surprising considering OSU is by far the largest institution within the OhioLINK consortium in terms of both students and faculty. Therefore OSU's use drives the total rankings for the consortium. Chart 1 suggests an orderly retreat based on the consortium's aggregate use data would not significantly disenfranchise users of these resources at OSU.
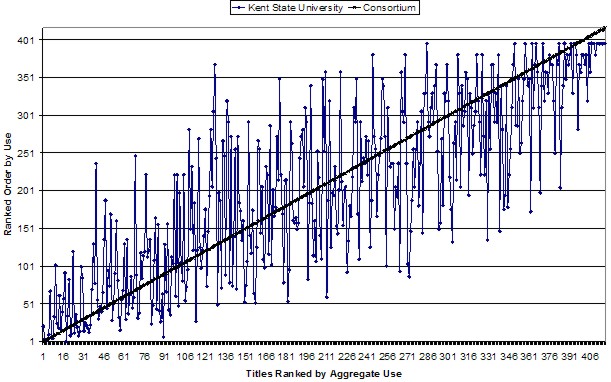
Chart 2 shows the same aggregate consortium data, but this time with the added use information for Kent State University (KSU), a large university within OhioLINK but smaller than OSU. While the general trajectory between the aggregate and KSU data remains the same as in Chart 1, the variation is much greater than between the aggregate and OSU data.
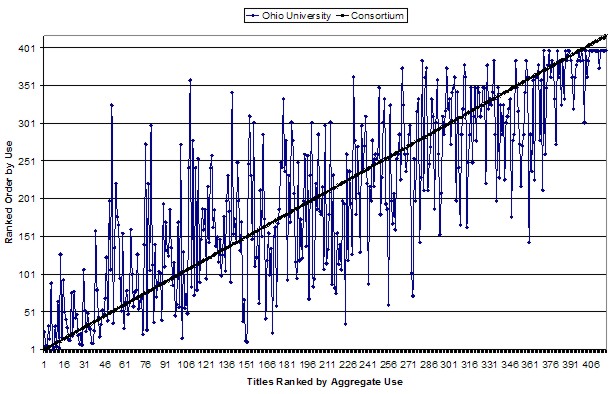
Chart 3 illustrates the relationship between the aggregate consortium data and information for Ohio University (OU), similar in size and mission to KSU. Again, a similar trajectory is found, but also with very wide variations. On a title-by-title basis, the use patterns differ also between KSU and OU. Charts 2 and 3 demonstrate how an orderly retreat using the aggregate data may negatively affect consortium member institutions differently on a title-by-title basis.
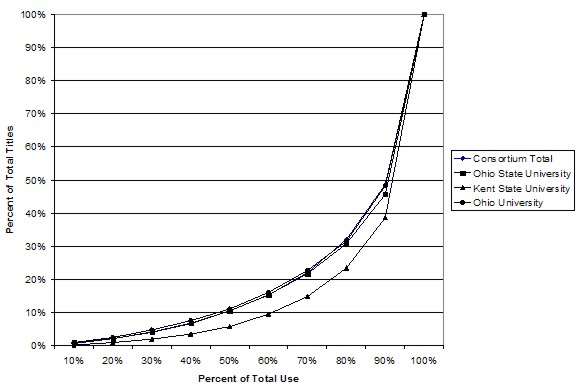
While there would be a negative impact on some institutions at almost every percentage level of reduction, the impact on total use remains unknown unless one examines how many titles account for what percentage of use. Chart 4 illustrates the percentage of a publisher's titles used as a percentage of total articles downloaded. Interestingly, for Publisher A (Publ-A) 80% of the total articles downloaded come from approximately 30% of the titles. While this is not quite the 80/20 rule, the same principle is in effect—the majority of use comes from a minority of the titles. This, combined with the relatively high correlations of rank order between institutions, indicates a fairly large number of titles could be eliminated during an orderly retreat without a significant negative affect on the total number of article downloads at any one institution. Even if some titles representing relatively higher use at a particular institution were eliminated from a Big Deal, chances are the use of these particular titles still represents only a small percentage of total article downloads for the given publisher at the affected institution.
Table 3 provides a concrete example, using Publ-A, to examine the impact of using the aforementioned orderly retreat mechanism for a 3% reduction. Row 3 indicates the number of titles required to total a 3% attrition if each university acted independently. The range is from a low of 127 to a high of 169 titles. Compare this to the 127 titles lost in the far right column of Row 4 using the aggregate consortium data. Row 4 also indicates how many of these 127 titles each university uses. Under the aggregated consortium approach, each university loses far fewer of their used titles than if acting alone. But are these the lowest used titles for each university? The relatively high correlations indicate the answer is mostly yes. Row 5 shows the number of titles for each university within the 127 aggregate that would not have been cut based on individual university use profiles but that are lost using the consortium-level data. However, Row 6 reveals that the consortium orderly retreat mechanism still results in only about 3% of lost article downloads for each university. Five institutions actually experience a <3% loss and only one a >4% loss. For the three universities specifically noted above, the results are typical.
|
Table 3 - Titles lost under a 3% orderly retreat scenario
| Row | Universities -> | A | B | C | KSU | E | OSU | OU | H | I | J | K | L | M | CONSORTIUM |
| 1 | Titles used: | 387 | 399 | 387 | 395 | 374 | 409 | 396 | 407 | 405 | 372 | 398 | 390 | 355 | 417 |
| 2 | Titles representing 97% of article downloads: |
238 | 234 | 254 | 240 | 229 | 272 | 272 | 238 | 272 | 245 | 272 | 250 | 214 | 290 |
| 3 | Titles lost at individual university 3% reduction: |
149 | 135 | 133 | 155 | 145 | 137 | 124 | 169 | 133 | 127 | 126 | 140 | 141 | |
| 4 | Titles lost at aggregate consortium 3% reduction: |
97 | 109 | 98 | 106 | 92 | 119 | 106 | 117 | 115 | 85 | 109 | 100 | 76 | 127 |
| 5 | Disenfranchised titles lost at aggregate consortium 3% reduction: |
20 | 12 | 22 | 20 | 20 | 13 | 21 | 13 | 16 | 15 | 23 | 17 | 11 | 0 |
| 6 | Percent of article downloads lost at aggregate consortium 3% reduction: |
3.4% | 2.2% | 3.4% | 2.9% | 3.3% | 2.9% | 3.8% | 2.8% | 3.1% | 3.4% | 4.3% | 3.8% | 2.2% | 3.0% |
|
ConclusionAre use patterns of titles within a Big Deal similar across consortium institutions to allow for an orderly (title-by-title) retreat without disenfranchising one or more consortium members? The analysis presented here allows for several of observations:
Therefore, an orderly retreat based on the ranking of articles-downloaded aggregated across member institutions appears to be a reasonable method to employ if needed. This method simplifies the process, allows for quick decision-making, and minimizes the impact on users throughout the consortium. An effective orderly retreat means consortia have the ability to manage a Big Deal based on a "cost for content" approach. OhioLINK's orderly retreat mechanism probably would not work for the single institution that has married its electronic collection to its historical collection. The mechanism will probably not work for a consortium with uniformly broad collections and relatively small additional titles in their Big Deals. There will be a natural tendency to use the historical associations with print expenditures in both these cases. Also, this new mechanism probably will not work where individual institutions under a consortium umbrella are still making local institutional title decisions. But for groups with similar collections and use dynamics and that can act uniformly as OhioLINK can, the mechanism does provide a workable solution to create more manageable long-term Big Deals. Even if it is not possible to sustain access to 100% of a publisher's collection, it is possible to maintain access to those titles that deliver the vast majority of use or meet other criteria. The OhioLINK orderly retreat mechanism does make it possible to make adjustments in hard times without forgoing the advantages of the Big Deal. ReferencesFrazier, Kenneth (March 2001). The Librarians' Dilemma: Contemplating the Costs of the "Big Deal." D-Lib Magazine, 7 (3) [online]. <http://dx.doi.org/10.1045/march2001-frazier> (accessed October 8, 2004). Peters, Thomas A. (July 2001). "What's the big deal?" Journal of Academic Librarianship, 27 (4):302-304. "To the Editor." D-Lib Magazine, 7 (4) [online]. <http://dx.doi.org/10.1045/april2001-letters> (accessed October 8, 2004). Copyright © 2004 Jeffrey N. Gatten and Tom Sanville |
|
| |
|
|
Top | Contents | |
| | |
|
D-Lib Magazine Access Terms and Conditions doi:10.1045/october2004-gatten
|