|
Search | Back Issues | Author Index | Title Index | Contents |
![]()
D-Lib Magazine
|
|
|
Tamara Sumner, Faisal Ahmad, and Qianyi Gu Francis Molina and Stedman Willard Michael Wright, Lynne Davis and
Sonal Bhushan Greg Janée |
![]()
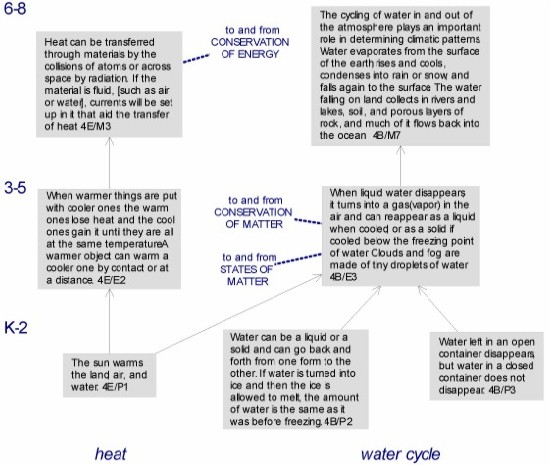
AbstractThe Concept Space Interchange Protocol supports the deployment of concept browsing interfaces in digital libraries. The protocol provides a programmatic web service interface to dynamically generate interactive visual components that enable users to navigate a concept space, request information about concepts, and request library resources aligned with concepts. The Concept Space Interchange Protocol has been implemented as part of the Strand Map Service, which enables digital library developers to create user interfaces and services based on primary and secondary science learning goals developed by the American Association for the Advancement of Science. The protocol and the overall service architecture are described. 1 IntroductionConcept browsing interfaces, based on nationally recognized educational standards, can help educators and learners to locate, comprehend and use educational resources in digital libraries. These interfaces provide navigational and orientational cues that are typically lacking from traditional keyword or fielded search interfaces. Prior research indicates that concept map representations are useful cognitive scaffolds, helping users lacking domain expertise—such as learners, new teachers, or educators teaching out of area—to understand the macro-level structure of an information space [1, 2]. We have created a web service interface supporting the construction of concept browsing interfaces based on the learning goals articulated in Benchmarks for Science Literacy [3]. These learning goals, or benchmarks, describe what learners should know, or be able to do, at key stages in their primary and secondary education across the natural sciences, mathematics, technology, and social science disciplines. Within the United States, the benchmarks provide a common framework for understanding relationships between national, state and local educational standards. Strand maps provide a visual representation that emphasizes the coherence intended in the benchmarks and invite both teachers and learners to make connections between ideas. The Atlas of Science Literacy [4], published by American Association for the Advancement of Science (AAAS) and the National Science Teachers Association, features strand maps on topics important to science literacy (e.g., weather and climate, flow of energy in ecosystems, or conservation of matter). Each map consists of node-link representations illustrating a set of relationships between benchmarks organized around a topic (Figure 1). High-level descriptions of the benchmarks are provided in the nodes, while the links depict the interrelationships between benchmarks. Each map contains vertical strands reflecting key ideas in that topic (e.g., heat, water cycle, atmosphere, and climate change are strands within the weather and climate map). Each strand is cross-referenced by grade levels (K-2, 3-5, 6-8, 9-12) to illustrate how student understanding develops over time.
2 The Strand Map ServiceThe Strand Map Service (the 'Service') supports the creation of concept browsing interfaces based on the Benchmarks and the Atlas. However, we believe this approach to be applicable to other concept spaces. The Service supports the needs of two audiences: primary and secondary school educators and learners (K-12), and digital library developers. These audiences are supported through the provision of two types of public interfaces: (1) a programmatic web service interface for use by digital library developers and (2) graphical concept browsing interfaces for use by K-12 teachers and learners. The programmatic web service interface enables digital library developers to easily construct concept browsing interfaces appropriate to the needs of their specific library audiences using dynamically generated visual components provided by the Service. The resulting concept browsing interfaces enable educators and learners to:
A functionally complete implementation of the Strand Map Service has been developed. This version of the Service is currently being used to create three demonstrator end-user interfaces for K-12 teachers and students within the National Science Digital Library (NSDL) network. The purpose of these interfaces is to illustrate how the Service can be embedded in different libraries, and yet still reflect the individual look-and-feel of each library. Rather than creating static presentations of strand maps, the Service middleware generates visualizations of maps and map components from information modeled in the Benchmarks Repository. Our approach builds on recent advances in visualization components [5] and programmatic interfaces to knowledge organization systems [6]. Figure 2 illustrates the overall Service architecture. The Benchmarks Repository is a database housing the benchmarks, strand maps, and related information. The Service middleware uses query adapters, designed to search over different collections within NSDL, in order to locate resources that support learning goals articulated in the benchmarks. The Service is architected to support a 'spectrum of interoperability' to maximize its utility for a broad range of digital library projects [7]. Specifically, library developers can create interfaces and services by making calls to our web service interface or by harvesting benchmark information using the OAI-PMH server.
2.1 The Concept Space Interchange ProtocolLibrary developers create concept browsing interfaces by requesting information using the web service interface: the Concept Space Interchange Protocol (CSIP). The design of CSIP is based on the Representational State Transfer (REST) web architectural style [8]. CSIP supports three types of requests: (1) service description (which returns information about the capabilities and version of this instance of the Service), (2) submit resource (which is used to submit additional benchmark information to the Service), and (3) query (which is used to request AAAS information and visual components useful for creating concept browsing interfaces). Library developers initiate requests using either HTTP Get (for service description and submit resource requests) or HTTP Post (for query requests) with a unique URL associated with each of the three request types. Examples of some of the requests supported by the protocol include:
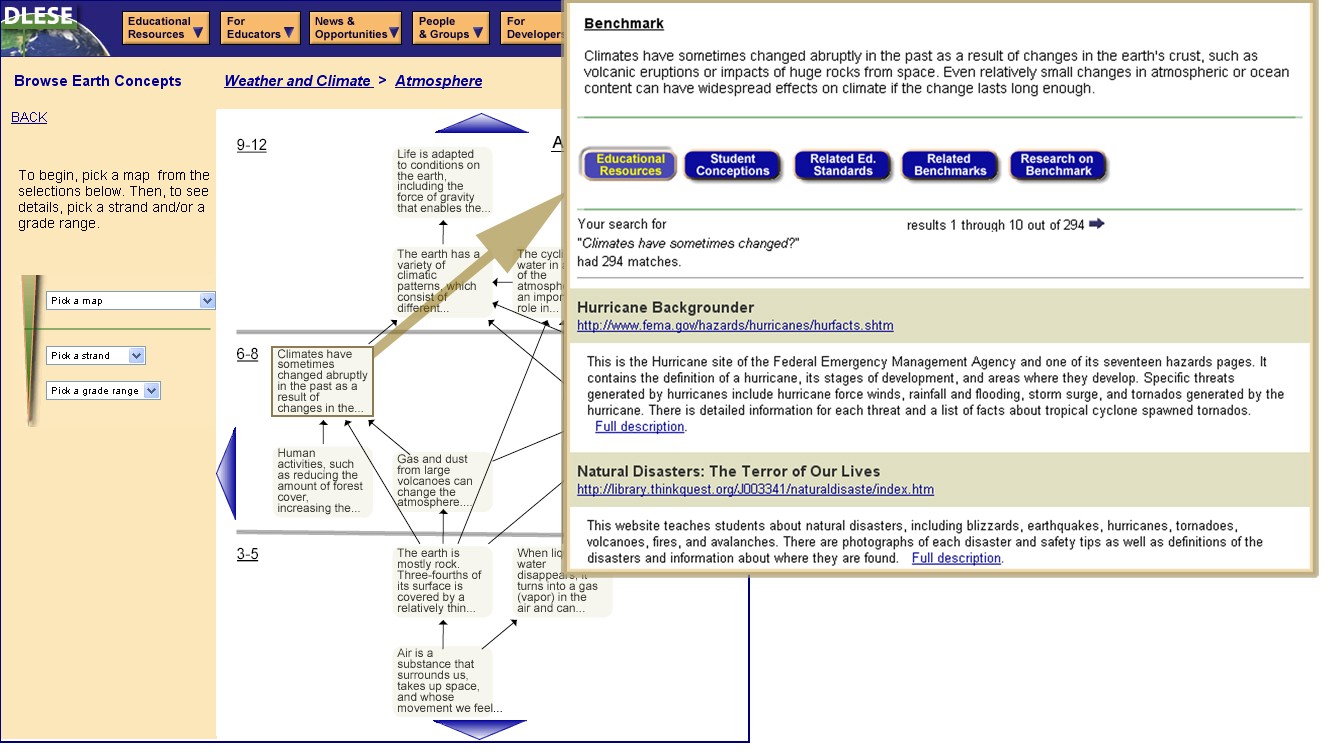
CSIP Version 1.0 supports twelve visual components. Some of these components provide different ways of viewing information in the Benchmarks Repository; e.g., 'map viewer', 'strand viewer', or 'benchmark information viewer'. Other components support different ways of navigating through this information space; e.g., 'map tree navigator' or 'cluster navigator'. When the user performs an action in a client interface, the interface makes an information request to the Strand Map Service, such as "retrieve all the benchmarks associated with a particular strand." The Service returns the requested information as XML or as Scalable Vector Graphics (SVG) [9], as specified by the developer at implementation time. Returning the information as XML provides flexibility, developers can use or display the information in any way they see fit. Developers can request that this XML information be returned in a specified metadata format: either the native Strand Map Service Framework or as Qualified Dublin Core. The SVG option enables developers to easily construct concept browsing interfaces from interactive visual components that are dynamically generated by the Service. Using this option, the same information is returned to the interface as in the XML option, but it is already embedded in a visual component that can be directly displayed and interacted with in the client interface. 2.2 An ExampleFigure 3 shows a demonstrator created for the Digital Library for Earth System Education (DLESE—http://www.dlese.org). Users can browse strand maps in two ways: using the pull down menus (on the left) or by direct manipulation of map elements. The menus use the XML option supported by CSIP; information in the Service is used to populate this DLESE-specific interface element created by DLESE developers to mimic menus in the rest of the library. The interactive map visualizations use CSIP's SVG option; the Service is dynamically generating map, strand, and benchmark 'viewer' components in response to user actions in the interface. Representing the concept space in terms of maps and strands reflects the major visual representations published in the Atlas of Science Literacy. However, the Service can also generate new visualizations, inherent in the Benchmarks Repository data model, that have never been published. An example of this capability in the DLESE demonstrator is the option to view "Related Benchmarks" on the benchmark description page. This option displays the pre-requisites and post-requisites of the selected benchmark (nearest neighbors) in a single map view. In the Atlas, these neighboring benchmarks are typically spread across several of the two-dimensional published maps. The Service can retrieve resources that are indexed as being aligned with a particular benchmark or related educational standard. Alternatively, resources can be retrieved using keywords and audience information corresponding to a particular benchmark or standard; this information is modeled in the Benchmarks Repository.
3 ConclusionsThe merit of our approach lies in its innovative use of web services technology to provide an educationally relevant visualization service across distributed library sites, as opposed to creating a visualization interface for a single library. Additionally, the Service can help educational libraries meet a pressing national requirement: since the passage of the No Child Left Behind legislation, educators are increasingly seeking educational resources that are aligned to national and state standards. As such, libraries using the Service can serve as important facilities helping educators to locate resources that support recognized standards and to integrate these resources into coherent learning activities. We hope that concept browsing interfaces created with the Service will help teachers and students to understand that science is not a list of facts to memorize, but instead a rich network of ideas to explore. AcknowledgementsThis research is funded in part by the National Science Foundation under NSF Award #0226286. Any opinions, findings, conclusions or recommendations expressed in this material are those of the author(s) and do not necessarily reflect the views of the National Science Foundation. References1. Hall, R.H., Hall, M.A. and Saling, C.B. The effects of graphical postorganization strategies on learning from knowledge maps. Journal of Experimental Education, 67 (2). 101-112. 2. O'Donnell, A.M., Dansereau, D.F. and Hall, R.H. Knowledge Maps as Scaffolds for Cognitive Processing. Educational Psychology Review, 14 (1 (March)). 71-86. 3. AAAS Benchmarks for Science Literacy. Project 2061, American Association for the Advancement of Science, Oxford University Press, New York, 1993. 4. AAAS Atlas of Science Literacy. Project 2061, American Association for the Advancement of Science, and the National Science Teachers Association, Washington, DC, 2001. 5. North, C. and Schneiderman, B. Snap-together visualization: can users construct and operate coordinated visualizations? International Journal of Human Computer Studies, 53 (5). 715-739. 6. Binding, C. and Tudhope, D. KOS at your Service: Programmatic Access to Knowledge Organisation Systems. Journal of Digital Information, 4 (4, Article No. 265, 2004-02-05) <http://jodi.ecs.soton.ac.uk/Articles/v04/i04/Binding/>. 7. Arms, W., Hillmann, D., Lagoze, C., Kraft, D., Marisa, R., Saylor, J., Terrizzi, C. and Van de Sompel, H. A Spectrum of Interoperability: The Site for Science Prototype for the NSDL D-Lib Magazine, 2002 <doi:10.1045/january2002-arms>. 8. Fielding, R.T. and Taylor, R.N. Principled Design of the Modern Web Architecture. ACM Transactions on Internet Technology, 2 (2 (May)). 115 - 150. 9. W3C. Scalable Vector Graphics (SVG) 1.1 Specification, Ferraiolo, Jon, Fujisawa, Jun, and Jackson, Dean, 2003, <http://www.w3.org/TR/SVG/>. Copyright © 2004 Tamara Sumner, Faisal Ahmad, Sonal Bhushan, Qianyi Gu, Francis Molina, Stedman Willard, Michael Wright, Lynne Davis, and Greg Janée |
|
| |
|
|
Top | Contents | |
| | |
|
D-Lib Magazine Access Terms and Conditions doi:10.1045/november2004-sumner
|