D-Lib Magazine
July/August 1999
Volume 5 Number 7/8
ISSN 1082-9873
Creating a Large-Scale Digital Library for Georeferenced Information
Bin Zhu
Management Information System Dept.
University of Arizona
Tucson, AZ 85721, (520) 621-3927
[email protected]Marshall Ramsey
Management Information System Dept.
University of Arizona
Tucson, AZ 85721, (520) 621-3927
[email protected]Tobun D. Ng
Management Information System Dept.
University of Arizona
Tucson, AZ 85721, (520) 621-4436
[email protected]Hsinchun Chen
Management Information System Dept.
University of Arizona
Tucson, AZ 85721, (520) 621-4153
[email protected]Bruce Schatz
CANIS LAB
University of Illinois at Urbana-Champaign
704 S. 6th St.
Champaign, IL 61801
[email protected]
Abstract
Digital libraries with multimedia geographic content present special challenges and opportunities in today's networked information environment. One of the most challenging research issues for geospatial collections is to develop techniques to support fuzzy, concept-based, geographic information retrieval. Based on an artificial intelligence approach, this project presents a Geospatial Knowledge Representation System (GKRS) prototype that integrates multiple knowledge sources (textual, image, and numerical) to support concept-based geographic information retrieval. Based on semantic network and neural network representations, GKRS loosely couples different knowledge sources and adopts spreading activation algorithms for concept-based knowledge inferencing. Both textual analysis and image processing techniques have been employed to create textual and visual geographical knowledge structures. This paper suggests a framework for developing a complete GKRS-based system and describes in detail the prototype system that has been developed so far.
1. Introduction
The emergence of digital libraries with geospatially-referenced multimedia content has created special challenges and opportunities. Part of the challenge of geographic information retrieval stems from the diversity of the information media used in geospatial information systems. In addition, geospatial queries utilize fuzzy, concept-based terms. A particular challenge confronted by geospatial research is to develop technologies that support both forms of information retrieval (Larson, 1996). The two primary classes of geospatial queries are "What's there?" and "Where's that?" Both of these involve describing geographic locations ("Where") using either precise references (e.g., coordinates) or fuzzy terms such as place names or features (e.g., river, Santa Barbara County). In addition, concept-based queries involving the description of geographic attributes such as temperature, vegetation, or land surface type and geographic phenomena such as rainfall, earthquakes, or wind (the "what" of geospatial information systems) are even more complicated.
In a text-based geographic information retrieval system, using subjective terms in description is a classic difficulty because of the vocabulary difference problem (Chen, 1994; Lancaster, 1979). The description of "what" becomes even more difficult for image-based geographic information retrieval. To counteract the non-scalability of traditional algorithms that use textual annotation to represent images, most current image retrieval systems represent images by their low-level features such as texture, color, and shape (Pentland, 1994; Flickner, 1995; Manjunath, 1996). This requires users of a digital library to know which image low-level features are associated with different concepts, in order to retrieve information on the "what" of the system. This is usually not the case.
In this paper, we present a Geographical Knowledge Representation System (GKRS) (Chen, et al., 1998) that applies various artificial intelligence (AI) and image processing techniques to support concept-based geographic information retrieval. As a joint effort between the Illinois Digital Library project (Schatz, et al., 1996; Chen, et al., 1996) and the UCSB Digital Library project (Smith, 1996) and later funded through the DARPA Information Management Program, the GKRS prototype system integrates various multimedia knowledge sources and adopts spreading activation algorithms for concept-based reasoning. In addition to allowing users to browse attributes of a queried area as do most geographical information systems (GIS), the GKRS provides an interface that enables users to specify parallel queries of "what" in both verbal and image formats.
2. Technology Overview
The GKRS utilizes four primary types of technology in its implementation. They are:
Automatic Indexing, Co-occurrence Analysis, and Associative Analysis
Automatic indexing, co-occurrence analysis, and associative retrieval are used in the GKRS to alleviate search uncertainty by generating the right terms to retrieve the information of interest. A detailed description of this technology can be found in Chen & Lynch (1992).
Self-Organizing Map (SOM)
As an information categorization and visualization technique, SOM was first proposed by Kohonen, who based his neural network on the associative neural properties of the brain (Kohonen, 1995). SOM is defined as a projection from a high-dimensional input space into a two-dimensional array of output nodes, of which those that are topographically close are considered to be similar to each other. In addition, its two-dimensional output makes SOM an ideal candidate for information visualization. Several recent studies have adopted the SOM approach to textual analysis.
Image Representation
The traditional algorithm for representing an image is based on its author, date, and content. However, this approach is unable to capture the complete content of an image, and it requires manual effort to define and enter the necessary annotation. A second, and promising, research alternative searches images based on their low-level features. A variety of algorithms can be employed to extract low-level features in image retrieval systems. The selection of an algorithm for image representation varies with the image type. In our prototype system, since we used aerial photos as input, we employed Gabor filters as our image representation algorithm. As indicated in Manjunath & Ma (1996), Gabor filters perform better than the other image representation algorithms in representing aerial photos.
Image Compression
Users often expect an image retrieval system to return a set of images that match their queries. Maintaining a hierarchical set of images at differing resolutions allows the system to meet this user requirement without sacrificing performance, especially if web-based image retrieval is the delivery system of choice. The system first returns a set of low-resolution images, and then presents the high-resolution version of an image selected by a user. The image knowledge source of the prototype system uses the Joint Photographic Experts Group (JPEG) compression. A useful feature of JPEG is that it permits a trade-off of image size against image quality, allowing adjustment of image quality by changing the compression parameters.
3. A Concept-based Multi-media System Design
Figure 1 shows a schematic diagram of the proposed architecture, which includes a top-down ontological view of knowledge structure development and a bottom-up, inductive approach to extracting desired information from textual and image databases. In the diagram, knowledge sources or structures are depicted by ovals, and processes and techniques are represented by rectangular boxes. The resulting body of integrated information (the dotted oval) is shown as loosely coupled networks of knowledge sources. In the current prototype system, there are three types of knowledge sources: textual knowledge sources, image knowledge sources, and numerical knowledge sources.
- The textual knowledge source
The textual knowledge source is a set of concept spaces derived from textual documents from different domains. The textual knowledge source uses automatic indexing to represent the content of a document with terms. It then applies co-occurrence analysis to identify relationships among the extracted terms. The concept space created thus has the capability to understand the query terms given by a user and return a list of related terms. The user then can refine the information request by selecting more precise terms. In addition, with the associative retrieval technique, the textual knowledge source may activate some other terms related to the query terms given by a user to retrieve more complete information.
- The image knowledge source
Applying an image representation technique, the image knowledge source represents an image by its low-level features such as color, shape, and texture. SOM is then applied to the extracted features to categorize the image. The image knowledge source uses an image as the label of each created category and employs the two-dimensional output of SOM as its interface. Thus the interface of an image knowledge source is a graphical representation of image categorization. A user can specify query by selecting one of the label images and can browse images by choosing the category of interest.
- The numerical knowledge source
The numerical knowledge source creates feature vectors to represent the content of the numerical information and applies the SOM to categorize the created feature vectors. The numerical knowledge source supports numerical data information retrieval based on the categorized information.4. The Implementation of the Prototype System
We applied the technologies identified in Section 2 to create the textual knowledge source, the image knowledge source, and the numerical knowledge source. Each knowledge source had one media type as the basis for its input information. The textual information used by the textual knowledge source included 50,000 geoscience-related abstracts from the Compendex geographic category provided by Engineering Information Inc.; 20,000 Georef records with abstracts from the American Geological Institute; and 800,000 petroleum abstracts from the University of Tulsa. The image knowledge collection was built from a collection of 800 aerial photos provided by the Map and Imagery Laboratory of Davidson Library at the University of California, Santa Barbara (UCSB), where the coverage and location of each image had been checked and corrected against a digital coastline supplied by the CIA World Data Bank and the World Vector Shorelines via Generic Mapping Tools software. The numerical information in the prototype system was the Advanced Very High Resolution Radiometer (AVHRR) data from the National Aeronautics and Space Administration (NASA), which provides the information about the vegetation density of land surfaces and surface air temperature.
In the GKRS, the textual knowledge source applies automatic indexing, co-occurrence analysis, and associative retrieval to its input textual information. The image knowledge source divides an image into small tiles and represents each tile by using the algorithm of Gabor filters. It then categorizes the created image features by utilizing the SOM method. Similarly, the numerical knowledge source also employs SOM to categorize its input numerical data. Moreover, the three created knowledge sources interact by using the Geographical Names Information System (GNIS) from the U.S. Geological Survey (USGS), a useful knowledge source for identifying relationships between precise coordinates and fuzzy place names.
The interface of the prototype system contains query frame (Figures 2, 4, or 9) and result frame (Figures 3, 6, 10). At the top-left corner on the query frame are five tabs named "AVHRR", "TERM", "TEXTURE", "REGION", and "AREA." The tabs labeled "TERM", "TEXTURE", and "AVHRR" are associated with the textual knowledge source, the image knowledge source, and the numerical knowledge source, respectively. Such interface structure enables users to retrieve information from all knowledge sources simultaneously. A user can click on more than one tab to specify a query in different formats. For instance, a user can click on the "TERM" tab to enter a textual term query (Figure 2), click on the "TEXTURE" to query image texture (Figure 3), click on the "AVHRR" to query vegetation temperature type in numerical format (Figure 9), and click on the "area" tab to indicate the corner coordinates of the area of interest. A "submit" button on a query frame permits a user to submit a query.
The information retrieved is displayed in the result frame (Figures 3, 6, 10). The result frame is divided into two parts, with one being a California map and the other displaying the list of query results. Between these two parts are five tabs that have similar functionality to the tabs in the query frame. Places with the attributes specified by the user can be displayed on the map, while the user can browse the geographic features of the area of interest by clicking on the tabs in the result frame. The two frames allow a user not only to specify "where" in the query frame and have the associated "what" displayed in the result frame, but also to enter "what" in the query frame in more than one format (textual, image, or numerical) and have distribution of "what" on the map returned.
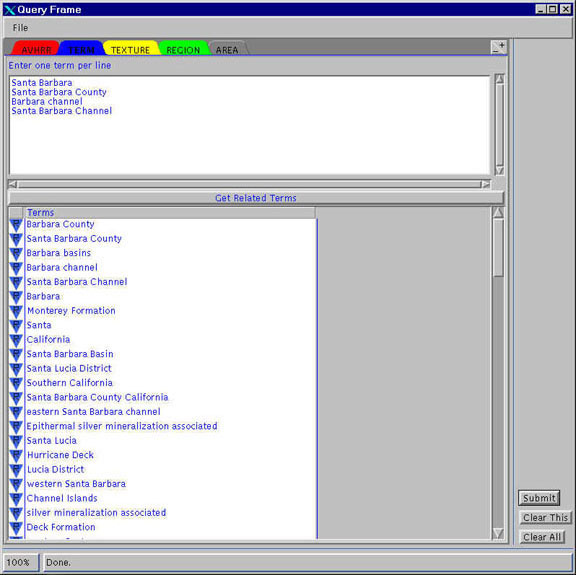
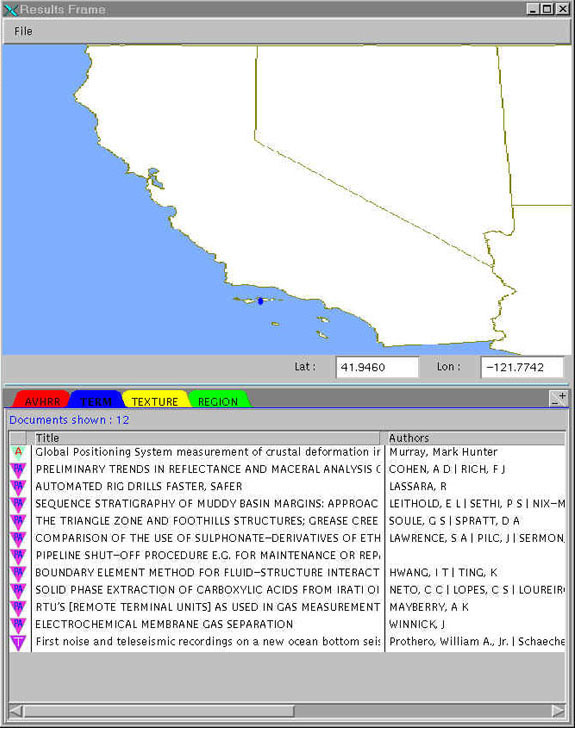
Figure 2 displays the query frame of the prototype when the tab "TERM" is clicked. As shown in Figure 2, after entering "Santa Barbara" as the initial search term, the system suggests "Santa Barbara County", "Santa Barbara Basin", "Santa Barbara Channel", etc. as relevant concepts. After deciding on appropriate search terms, a user can then submit a query and the results will be displayed on the result frame (Figure 3). The user can draw a square on the map to choose a place of interest and then browse its geographic attribute by clicking on different tabs. In Figure 3, the "TERM" tab was clicked, and the system returned a list of textual documents related to the place of interest.
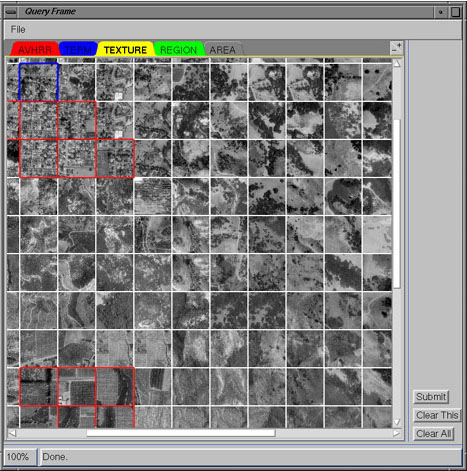
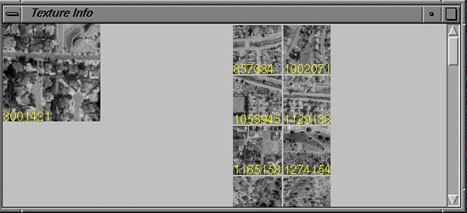
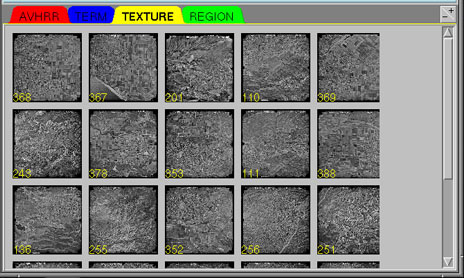
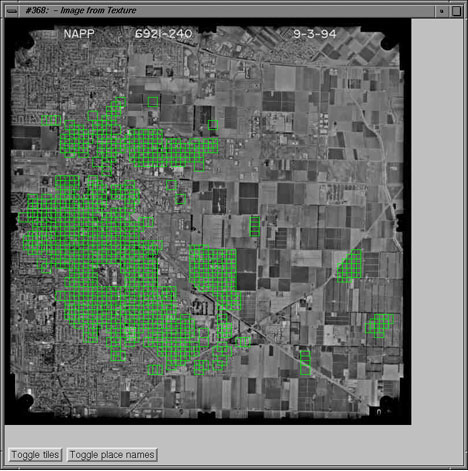
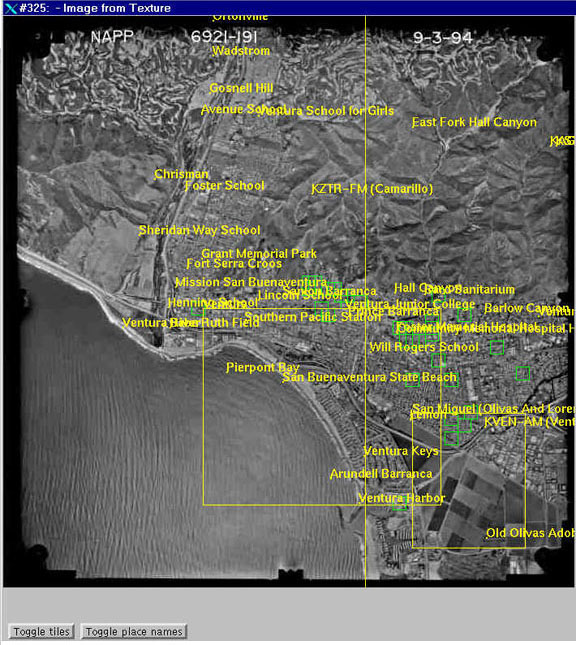
Figure 4 is an example of the query frame of the prototype system when the tab "TEXTURE" is clicked. The frame displays the representative tiles generated by SOM. Each tile is low-resolution (64 * 64 pixels). A user can get a close look at a tile of interest by right clicking on it. The system highlights the tile clicked in blue and brings up the "Texture Info" frame (Figure 5) to display the full resolution version of that tile and other tiles within the same group. The user can select more than one representative tile on the query frame as his or her query by left clicking on them. At the same time, all the selected tiles will be highlighted in red (Figure 4). For instance, in Figure 4, the user selected some tiles with an urban pattern and some tiles with a farm land pattern. After this user clicked on the "submit" button on the Query Frame, the system displayed a list of thumbnails of retrieved images in the results frame (Figure 6) where the tab "TEXTURE" had been clicked. The locations of the retrieved images are also displayed on the map, which has been truncated in Figure 6 in order to improve the visual quality of the figure. The images in this list were sorted according to the numbers of related tiles they contained. The Results Frame displays a set of the retrieved images in low resolution, from which the user can select any image in the list to activate the system to present a high-resolution version (700 * 700 pixels) of that image in the Image Frame, along with the related tiles highlighted in green (Figure 7). In addition, the system can also display the place names associated with this image (Figure 8) by cross-referencing with the GNIS gazetteer. Place names provide rich and important contextual information for aerial photo browsing.
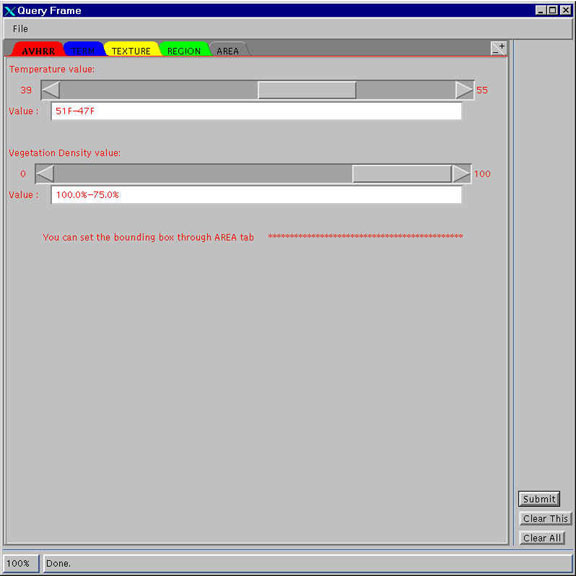
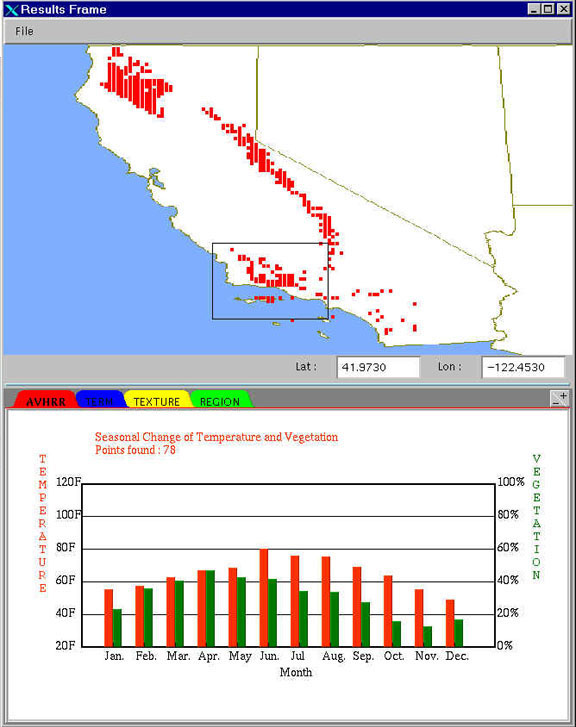
Figure 9 presents the query frame of the prototype system when the tab "AVHRR" is clicked. A user can specify vegetation-temperature pattern by clicking on the two scroll bars or typing into the fields. The results are displayed in Figure 10 where the tab "AVHRR" had been clicked. The places with the vegetation-temperature pattern that matches the user's query are displayed and the user can draw a square on the map to indicate the place of interest whereupon the system will bring up the seasonal changes of vegetation and temperature of the place selected (Figure 10).
5. Conclusion
Developing scalable techniques to support fuzzy, concept-based, multimedia geographic information retrieval has been considered one of the most pressing research questions for digital libraries. Our project aims to investigate geographic information retrieval technical and research issues using an integrated and scalable artificial intelligence approach.
In this project, we present a prototype Geospatial Knowledge Representation System (GKRS) that integrates multiple multimedia (textual and image) knowledge sources to support concept-based geographic queries and analysis. Based on semantic network and neural network representations, GKRS loosely couples different knowledge sources and adopts spreading activation algorithms for concept-based knowledge reasoning. Our extensive multimedia testbed of textual, image, and specialized geographic collections will allow us to continue to expand on our techniques and gradually evolve toward an intelligent and complete Geographic Knowledge Representation System.
The most current version of GKRS is not available through the Web. Some components of the system are accessible at our web page at <http://ai.bpa.arizona.edu/Lists/list_demos.html>.
Acknowledgement
The authors would like thank Professor Manjunath of UCSB for providing the software for the Gabor filters, and thank Larry Carver and Mary Larsgaard of the Map and Imagery Laboratory of UCSB for providing the aerial photo collections. We would also like to thank GeoRef Information Services of the American Geological Institute and the Petroleum Abstracts Service at The University of Tulsa, for contribution of bibliographic data and thesauri. Members of Arizona Artificial Intelligence Lab who directly contributed to this paper are Yohanes Santoso, Wojciech Wyzga, Andy Clements and Hadi Bunnalim.
This research is supported by:
- NSF/ARPA/NASA Digital Library Initiative. 1996-1998, "Supplement to Alexandria DLI Project: A semantic interoperability experiment for spatial-oriented multimedia data."
- NSF/ARPA/NASA Digital Library Initiative. IRI-9411381. 1994-1998. "Building the Interspace: Digital library infrastructure for a university engineering community."
- DARPA N6601-97-C-8535. 1997-2000, "The interspace prototype: An analysis environment based on scalable semantics."
References
Chen, H. & Lynch, K.J., (1992). Automatic construction of networks of concepts characterizing document database. IEEE Transactions on Systems, Man and Cybernetics, Vol. 22, No. 5, pp. 885-902.
Chen, H. & Ng, T.D. (1994). An algorithmic approach to concept exploration in a large knowledge network (automatic thesaurus consultation): symbolic branch-and-bound vs. connectionist Hopfield net activation. Journal of the American Society for Information Science, Vol.46, No. 5, 348-369.
Chen, H., Schatz, B., Ng, T.D., Martinez, J., Kirchhoff, A., & Lin, C. (1996). A parallel computing approach to creating engineering concept spaces for semantic retrieval: The Illinois Digital Library Initiative Project, IEEE Transaction on Pattern Analysis and Machine Intelligence, Vol. 18, No. 8, pp. 771-782.
Chen, H., Martinez, J., Kirchhoff, A., Ng, T.D., & Schatz, B. (1998). Alleviating search uncertainty through concept associations: automatic indexing, co-occurrence analysis, and parallel computing. Journal of the American Society for Information Science, Vol. 49, No. 3, pp. 206-216.
Flickner, M., Sawhney, H., Niblack, W., & Ashley, J. (1995). Query by image and video content: The QBIC system, IEEE Computer, Vol. 28, No. 9, pp. 23-33.
Kohonen, T. (1995). Self-Organized Maps, chapter 3. Springer-Verlag, Berlin Heidelberg.
Lancaster, F.W. (1979). Information Retrieval Systems. John Wiley & Sons, Inc.
Larson, R.R. (1996). Geographical information retrieval and spatial browsing. Geographical Information Systems and Libraries: Patrons, Maps, and Spatial Information. pp. 81-124.
Manjunath, B.S. & Ma, W.Y. (1996). Texture features for browsing and retrieval of image data. IEEE Transactions on Pattern Analysis and Machine Intelligence, Special Issue on Digital Libraries. Vol. 18, No. 8, pp. 837-842, November.
Pentland, A., Picard, R.W, & Sclaroff, S. (1994). Photobook: Tools for content based manipulation of image databases, Proc. SPIE, Vol. 2185, pp. 34-47, February.
Schatz, B.R. and Chen, H. (1996) Building large-scale digital libraries. IEEE Computer, Vol. 29, No. 5, pp. 22-27, May.
Smith, T.R. (1996) A digital library for geographically referenced material, IEEE Computer, Vol. 29, No. 5, pp. 54-60.
Figures
Figure 1. The Architecture of the GKRS
Figure 2. The Query Frame when the tab " TERM" is clicked. On this figure, the term "Santa Barbara" is entered, and the system suggests 40 related terms in the panel named "Get Related Terms." A user could select more than one related term by clicking on it.
Figure 3. The Result Frame when the tab "TERM" is clicked. On this figure, 12 documents are retrieved from the textual knowledge source. Their locations are calculated and presented as blue dots on the map. In this case, one location has been acquired. The numbers in the fields "Lat" and "Lon" indicate the latitude and the longitude of the point on the map pointed to by the mouse cursor (not shown on the figure).
Figure 4. The Query Frame when the tab "TEXTURE" is clicked. User-selected tiles are highlighted in red. A blue tile is the one under inspection.
Figure 5. The interface that displays the full resolution (128 * 128) of selected image tile and its similar tiles. The yellow number on each tile represents the tile number of that tile.
Figure 6. The Result Frame when the tab "TEXTURE" is clicked. The yellow number at the left bottom is the image number. A set of images with low resolution is displayed in this frame. The images are ranked according to the number of tiles that match user queries.
Figure 7. The Texture Frame of the image knowledge source. In this figure, high resolution version (700 * 700) of image 368 is displayed. The location of interested tiles are highlighted with green square.
Figure 8. The Texture Frame of the image knowledge source. In this figure, place names associated with the presented image are extracted from GNIS and are displayed on the image according to the in locations.
Figure 9. The Query Frame when the tab "AVHRR" is clicked.
Figure 10. The Result Frame when the tab "AVHRR" is clicked. The red dots on the map indicate the places with the specified vegetation-temperature pattern. A user could draw a square to indicate the area of interest. T he seasonal changes of temperature and vegetation density of this area are displayed. The left axis indicates the temperature magnitude, while the right axis provides the magnitude of vegetation density. The temperature is represented by a red bar and the vegetation density is represented by a green bar.
Copyright © 1999 Bin Zhu, Marshall Ramsey, Tobun D. Ng, Hsinchun Chen, and Bruce Schatz
Top | Contents
Search | Author Index | Title Index | Monthly Issues
Previous story | Next story
Home | E-mail the EditorD-Lib Magazine Access Terms and Conditions
DOI: 10.1045/july99-zhu