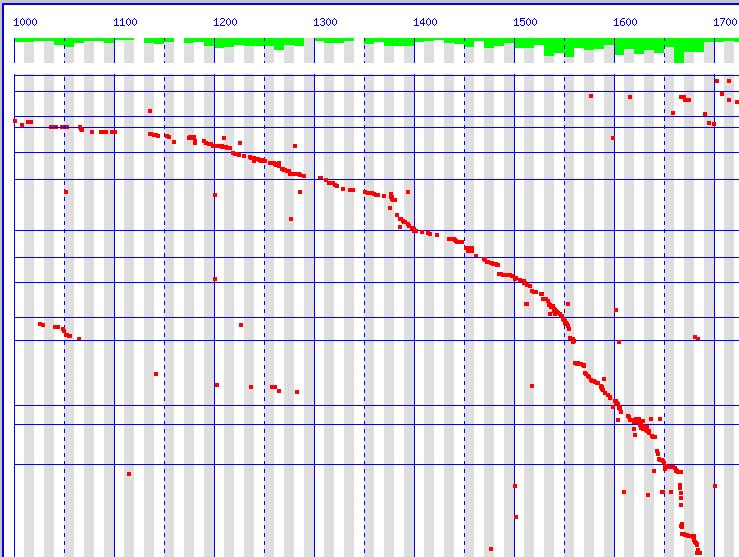
Figure 9: The dates in TIMELINE 2 above are scattered but the aggregate totals (figured in green above) show an unmistakable spike in the 1660s that then tapers down in subsequent decades.
Back to text of story.